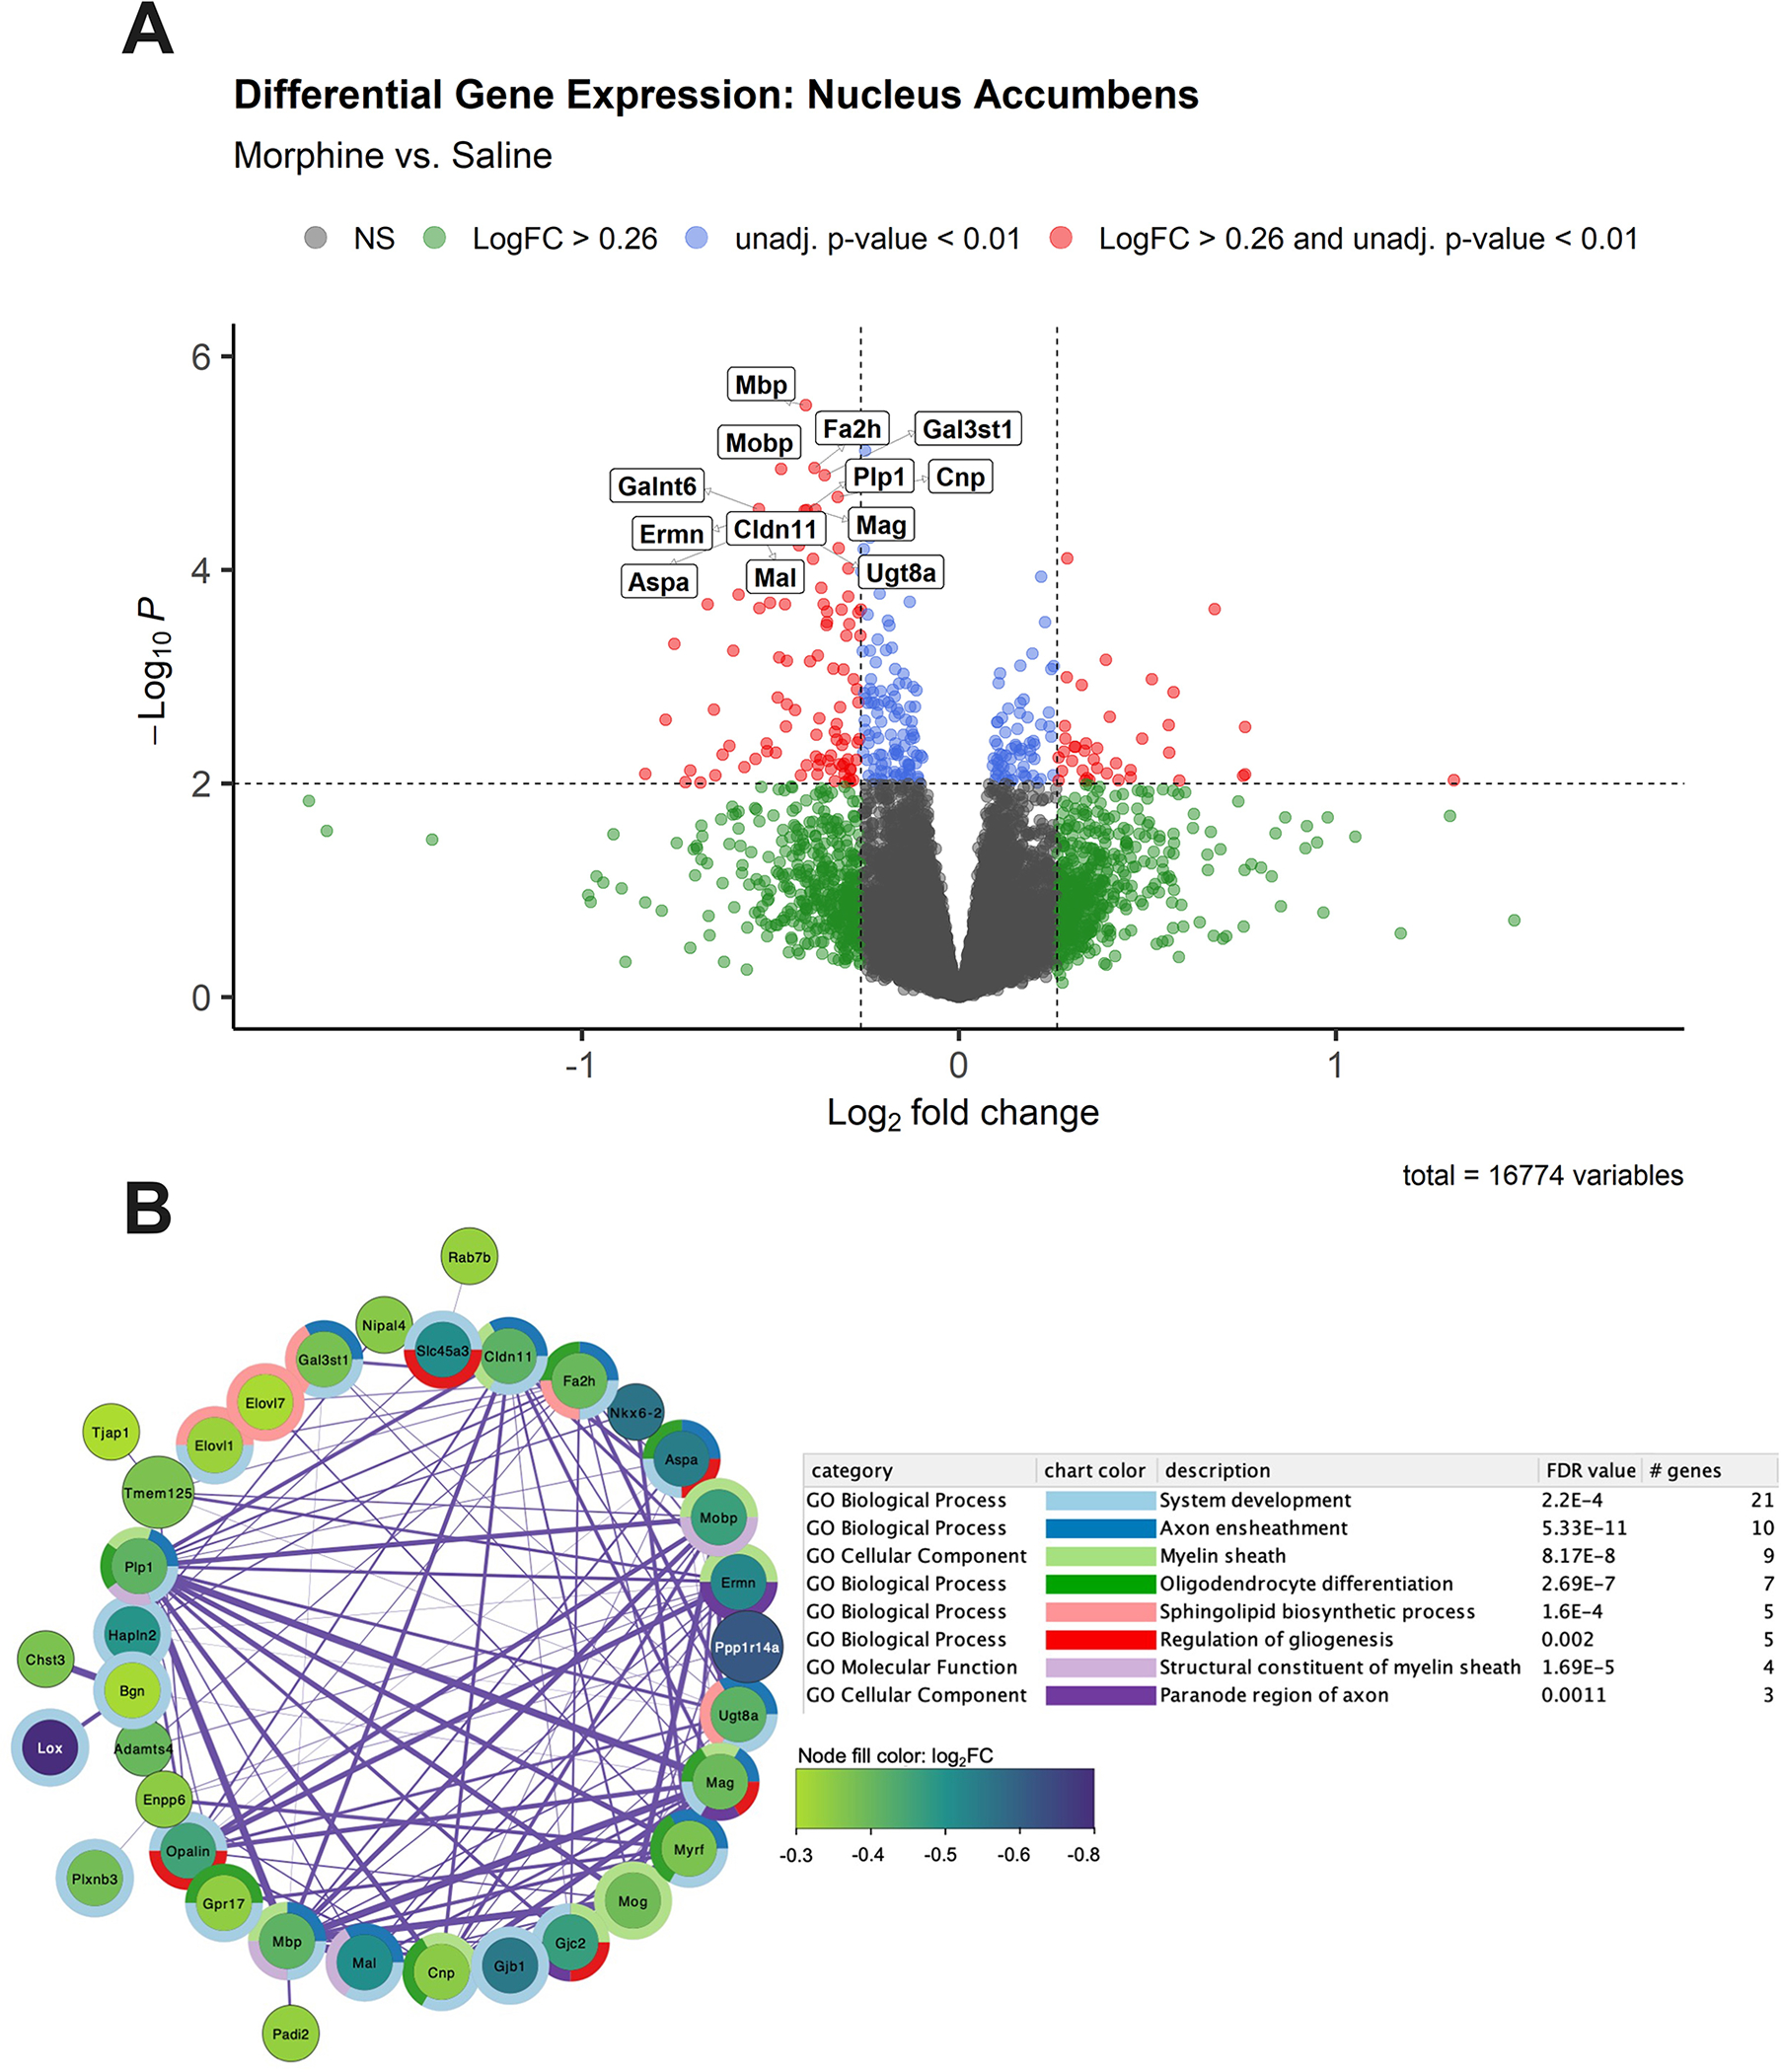
Figure 5. Bulk RNA-seq analysis in the nucleus accumbens (NAc) during spontaneous opioid withdrawal on P15 revealed significant down-regulation of myelin- and oligodendrocyte-related genes.

A. Volcano plot of gene expression in morphine mice [n = 14; 6 females, 8 males)] relative to saline mice [n = 14 (6 females, 8 males)]. The 13 genes with log2FC ≤ −0.26 and adjusted p values < 0.05 are labeled. Genes (n = 90) with log2FC ≤ −0.26 and unadjusted p < 0.01 were used as input for gene enrichment and network analysis. B. The largest subnetwork plot of significantly downregulated genes following neonatal morphine exposure is shown. Node color depicts gene log2FC from −0.3 (purple) to −0.8 (green) relative to saline controls. Surrounding donut plots show the top 8 significantly enriched GO pathways. Connecting lines represent gene interactions, with stronger interactions depicted as thicker lines. See Supplementary Table 1 for the full DEG list with unadjusted p < 0.01, and Supplementary Table 2 for a list of significantly enriched GO Biological Process pathways associated with morphine treatment,
