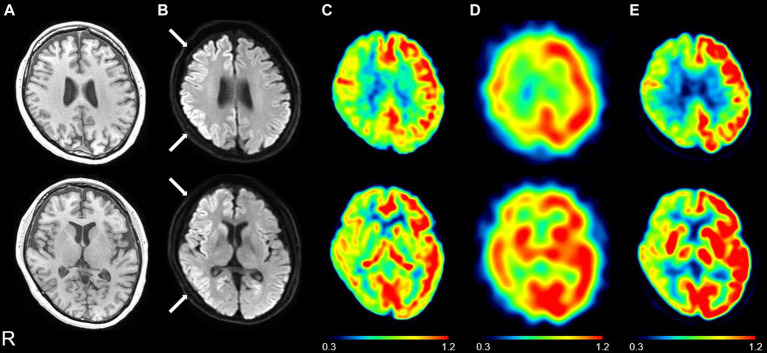
Figure 1.
Representative images of a patient with Creutzfeldt–Jakob disease (CJD) (CJD 2: patient in their 50s). Brain magnetic resonance imaging showed normal findings on the T1-weighted image (A); the right caudate nucleus, frontal, parietal, and temporal hyperintensity on the diffusion-weighted image (B) (see white arrows); and the right caudate nucleus, frontal, parietal, and temporal hypoperfusion on the cerebral blood flow map derived from arterial spin labeling (ASL) imaging (C) on day 24. 123I-N-isopropyl-p-iodoamphetamine single-photon emission computed tomography (SPECT) revealed right, frontal, parietal, and temporal hypoperfusion (D) on day 28, and 18F-fluorodeoxyglucose positron emission tomography (PET) revealed right caudate nucleus, frontal, parietal, and temporal hypoperfusion (E) on day 29. The color bar indicates the normalized values of ASL perfusion (C), SPECT perfusion (D), and PET uptake (E).

