Figure 4.
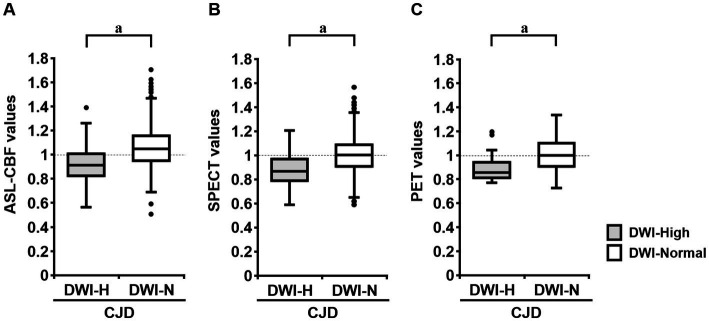
Box plot of the normalized values of arterial spin labeling (ASL)-cerebral blood flow (CBF) (N = 10; A), single-photon emission computed tomography (SPECT) (N = 8; B), and positron emission tomography (PET) (N = 3; C) in the DWI-High and DWI-Normal regions in patients with Creutzfeldt–Jakob disease (CJD). The mean ASL-CBF, SPECT, and PET values in the DWI-High regions were significantly reduced compared with those in the DWI-Normal regions (p < 0.001 for all) (A–C). A t-test was used to evaluate the differences between the DWI-High and DWI-Normal regions. aValue of p of t-test <0.001, compared with DWI-Normal.

