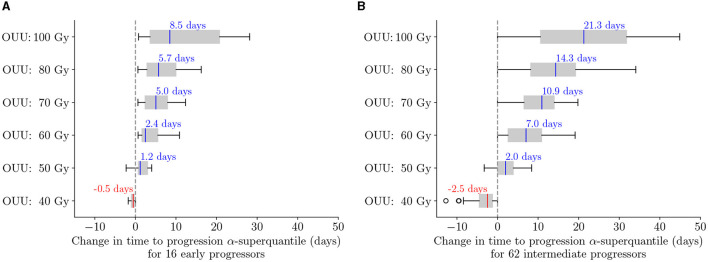
Figure 11.
Change in TTP α-superquantile when using optimal treatment regimens as compared to SOC for (A) early progressors: 16 patients with TTP α-superquantile <1 month after end of RT and (B) intermediate progressors: 62 patients with TTP α-superquantile between 1 and 3 months after end of RT. Median values are indicated in text above each box plot. The solution of the optimization problem in Equation (12) with Dmax = X Gy is indicated as “OUU: X Gy”. The median change indicates longer TTP compared to the SOC when optimal treatments are used.

