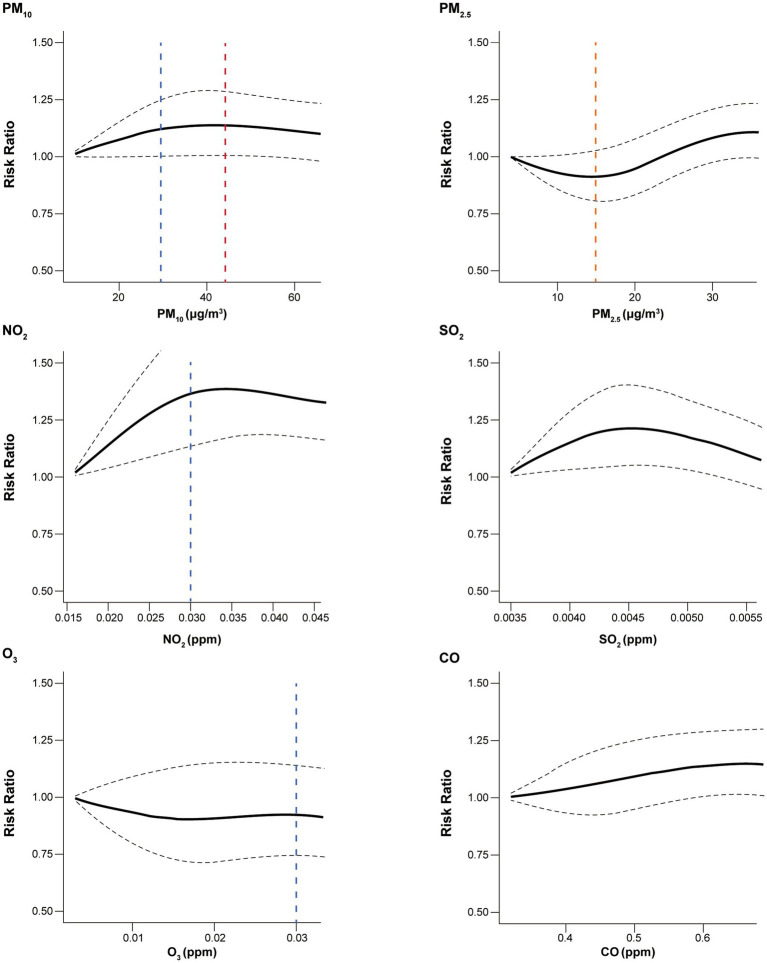
Figure 2.
Concentration–response curves for the association between all-cause healthcare utilization and air pollutants. Black dashed line indicates 95% confidence interval. Blue, red, orange vertical dashed lines indicate, the Korean, WHO, and the shared threshold for good air quality, respectively. The safe thresholds for SO2 and CO were higher than observed values. PM10, particulate matter of 10 μm or less in diameter; PM2.5, particulate matter of 2.5 μm or less in diameter; NO2, nitrogen dioxide; SO2, sulfur dioxide; O3, ozone; CO, carbon monoxide; WHO, World Health Organization.

