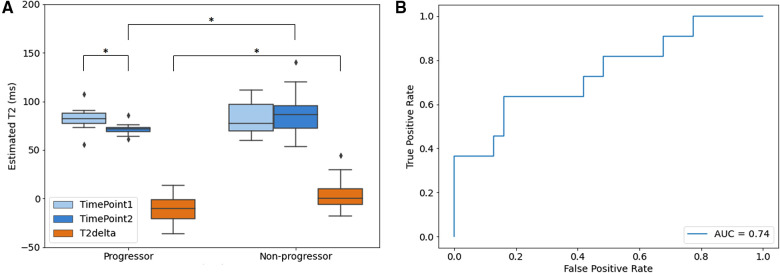
Figure 6.
Quantitative analysis results of aS dataset (group 2). (A) Box and whisker plot of the mean estimated T2 value of ROIs. Timepoint 1 (light blue), timepoint 2 (blue) and the corresponding T2 delta (orange) of progressor and non-progressor were shown separately with significance level of *P < 0.05; (B) ROC curve of the delta T2 value between timepoint 1 and timepoint 2. The boxes represent the interquartile range between 25–75th percentiles. The lines within boxes represent median value. The whiskers represent measurements 1.5 times interquartile range. The points represent outliers beyond 1.5 times the interquartile ranges.

