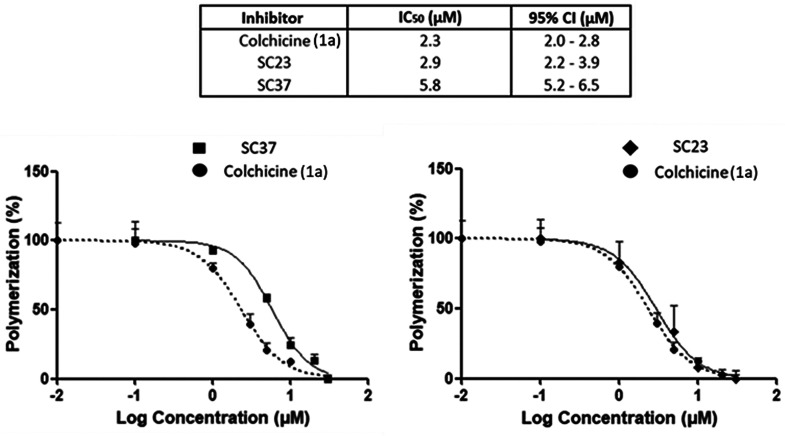
Figure 11.
Concentration–response curves and respective IC50 values of the most active tubulin polymerization inhibitors SC23, SC37, and control 1a (n = 3). Expressed as % polymerization with log (inhibitor) vs normalized response function, error bars (mean ± SD). Respective IC50 values and 95% confidence intervals for SC23, SC37, and 1a are found in Table 3.

