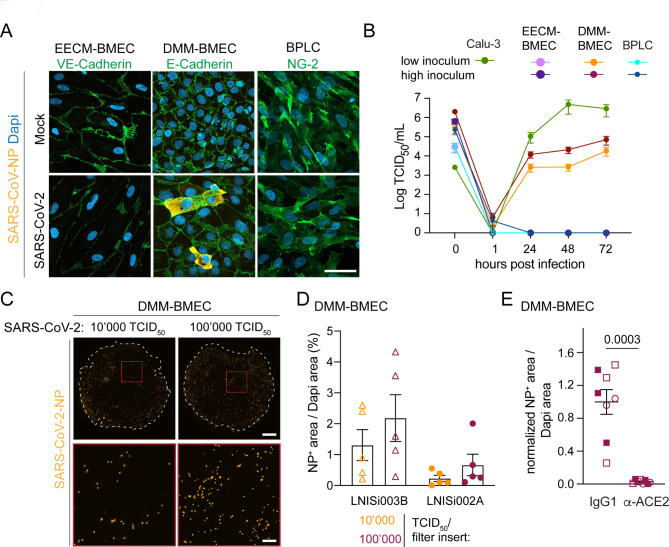
Fig. 2.
EECM-BMECs, DMM-BMECs and BPLCs differ in their susceptibility to SARS-CoV-2 infection. (A) Representative confocal images from immunofluorescence staining of SARS-CoV-nucleocapsid protein (NP) (orange) and VE-cadherin in EECM-BMECs (green), E-cadherin (green) in DMM-BMECs or neural/glial antigen-2 (NG2, green) in BPLCs 72 hpi with SARS-CoV-2 or Mock are shown. Nuclei were stained with DAPI (blue). Scale bar = 50 μm. (B) Quantification of released virions into the supernatant 1–72 hpi with SARS-CoV-2 by TCID50 assay. Measurement was done in duplicates from a total of 2 experiments with Calu-3 cells, 3 experiments with EECM-BMECs (each time a different iPSC clone and a low and high inoculum concentration), 2 experiments with DMM-BMECs derived from 2 iPSC clones (and a low and high inoculum concentration) and 4 experiments with BPLCs (with in total 5 iPSC clones and a low and high inoculum concentration). (C) Representative tile stack images of whole filter inserts of DMM-BMECs 72 hpi with SARS-CoV-2 at 10’000 and 100’000 TCID50/filter insert stained for SARS-CoV-NP (orange) are shown. White dashed circle indicates border of the filter inserts, red box delineates inset. Scale bar = 1 mm and for inset 200 μm. (D) Quantification of area of SARS-CoV-NP positivity normalized to area covered by DAPI is shown. Each dot represents one replicate from in total 2 experiments with 2 independent DMM-Differentiations from two clones. (E) Quantification of area of SARS-CoV-NP positivity normalized to area covered by DAPI is shown 48 hpi with SARS-CoV-2 at 100’000 TCID50/filter in presence of an anti-ACE2 blocking antibody or IgG control antibody. Data is normalized to IgG control. Each symbol type indicates an iPSC clone and each symbol is a replicate from in total 3 experiments with 3 DMM-differentiations from 3 donors. P-value was calculated by unpaired T-test with Welch’s correction

