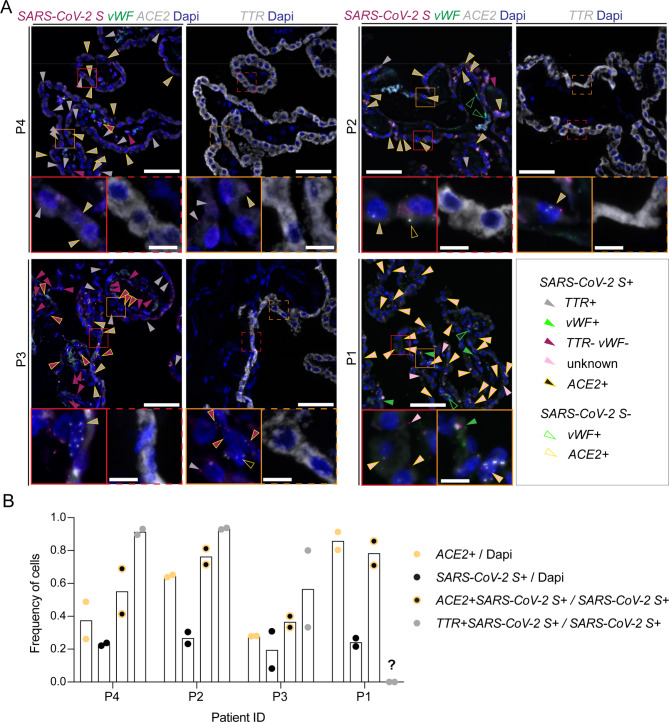
Fig. 6.
SARS-CoV-2 RNA is detected in ChP epithelial cells in COVID-19 patients. (A) Representative images from fluorescent RNA in situ hybridization for SARS-CoV-2 S (magenta), vWF (green) and ACE2 (grey) or transthyretin (TTR, grey) of ChP from 4 different patients are shown. Nuclei were stained with DAPI (blue). All images are maximum intensity Z projections. Red and orange boxes (full and dashed line) define area of inset. Scale bars = 50 μm and 20 μm for inset. Arrow heads mark all identified cells positive for transcripts as indicated in the legend. ACE2+SARS-CoV-2 S− cells (yellow-lined, transparent arrowhead) were only marked in the inset pictures. (B) Quantification of number of ACE2+ and SARS-CoV-2 S+ cells normalized to number of DAPI+ nuclei per section and of ACE2+SARS-CoV-2 S+ cells and of SARS-CoV-2+TTR+ epithelial cells normalized to the total number of SARS-CoV-2 S transcript positive cells. 2 sections per patient were analyzed, for patient P1 the corresponding area in the consecutive section stained for TTR could not be identified

