Fig. 3.
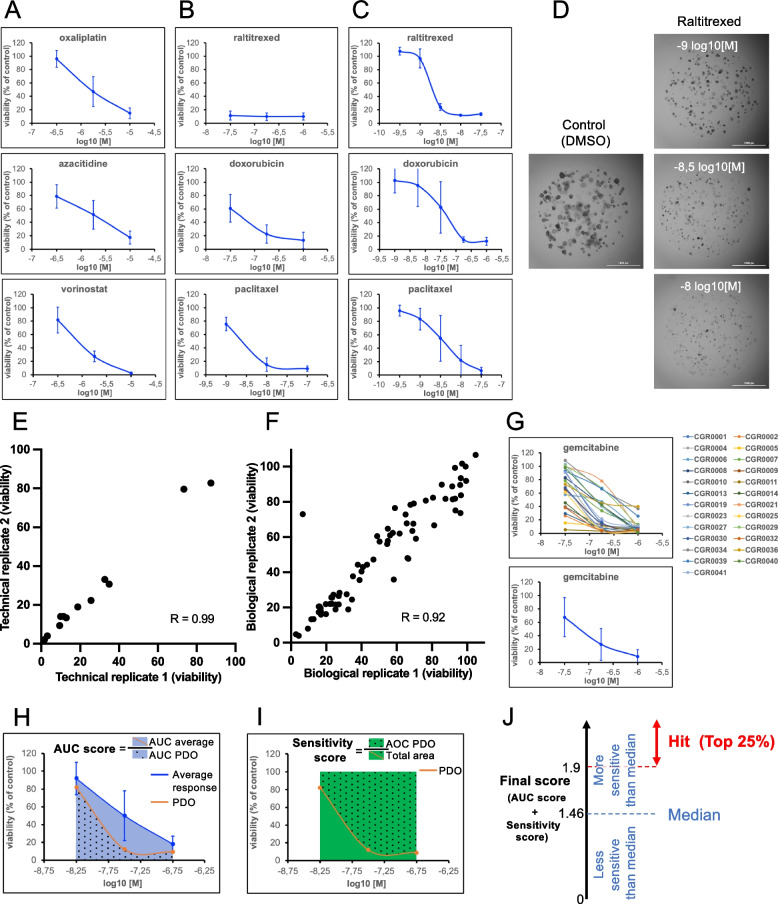
Chemogram Calibration. A-B Drug concentrations first characterization. Average response of 8 PDOs. C Drug concentrations second characterization. Average response of 8 PDOs. D Bright-Field imaging at day 8 of CGR0002 PDO exposed to 3 concentrations of Raltitrexed. E Drug test technical reproducibility. F Drug test biological reproducibility. G Relative viability (%) of the 25 PDO lines tested with gemcitabine at 3 concentrations (top panel). Bottom panel shows the average response of the 25 PDO lines to gemcitabine. H-J Scoring system. H AUC score: for each drug the average response of the 25 PDOs to an individual drug is determined (blue line) and allows for average AUC calculation (blue area ± dots). This AUC is divided by the AUC of the response of an individual PDO line (orange line and blue area with dots). I Sensitivity score: ratio between the area over the curve (green with dots) and the total area (green ± dots). J The AUC score was summed to the sensitivity score to give rise to the final score used in this study. Hit determination according to the median score of the entire dataset (25 PDOs tested with 25 drugs). Data are presented as the mean ± SD in A, B and C (n = 8 PDOs), as the mean ± SD in G (bottom panel; n = 25 PDOs), as the mean of triplicates in E (CGR0025 screened twice on the same run with 4 drugs at 3 concentrations (12 dots)), as the mean of triplicates in F (CGR0025 screened on two different runs with a 2-week interval for 25 drugs at 3 concentrations (75 dots)). Correlation is determined with the Pearson correlation coefficient (R) in E and F

