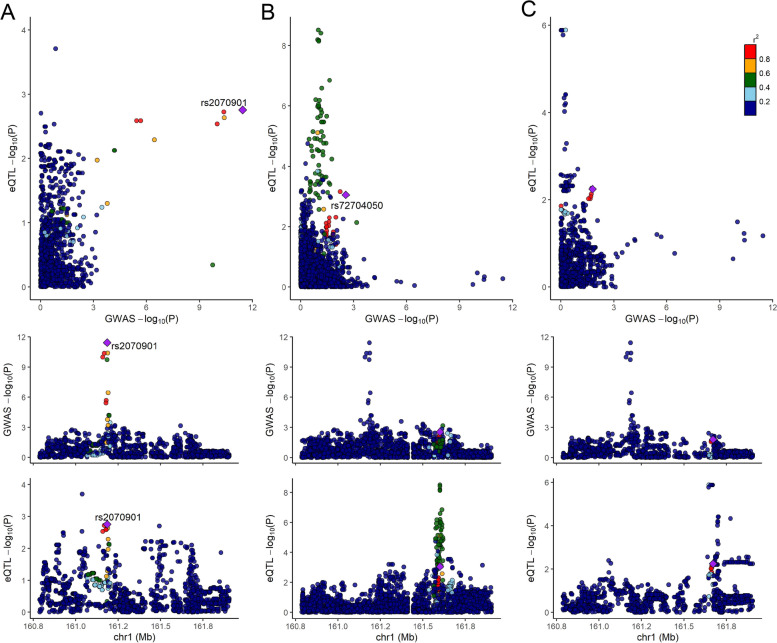
Fig. 3.
FCGR3A colocalization across the three eQTL data resources. Among all three eQTL datasets, namely the Korean asthmatic, GTEx, and Japanese eQTL data, FCRG3A showed a clear colocalization pattern in the Korean asthmatic data. The top panel presents a scatter plot to visualize the colocalization events, with eQTL P-values (y-axis) and GWAS P-values (x-axis). A bona fide signal should be present toward the top-right corner. The middle and bottom panels present regional plots for GWAS and eQTL P-values, respectively. A Korean asthmatic eQTL; B GTEx eQTL; and C Japanese eQTL

