Figure 8.
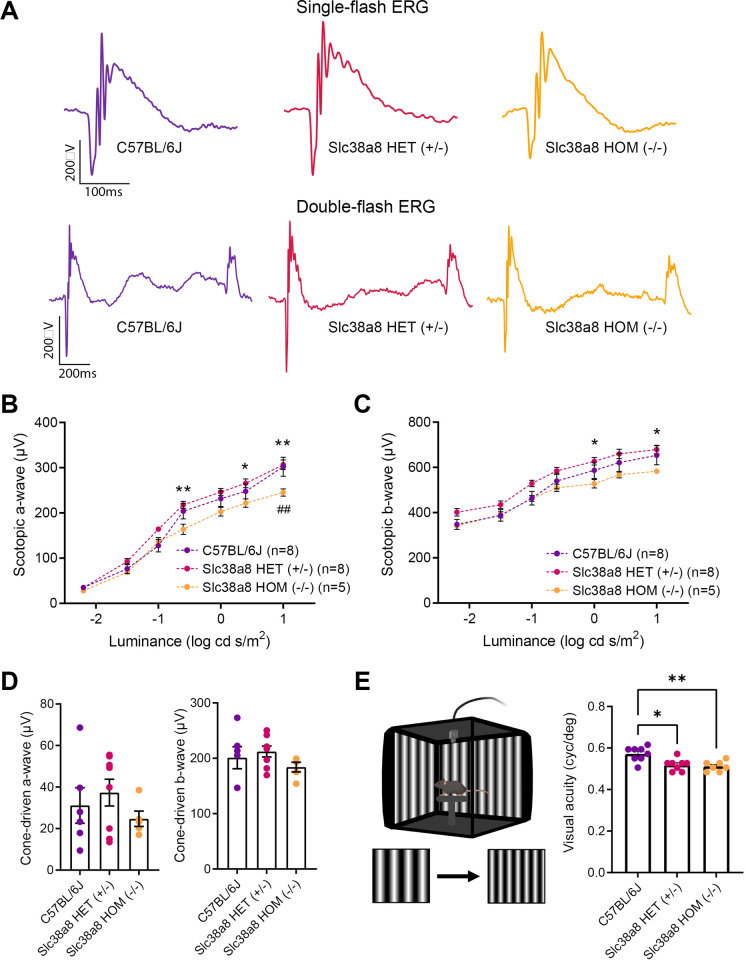
Functional retinal analysis of Slc38a8 mutant mice. Electroretinogram recordings in scotopic conditions were obtained from adult (2-3 months old) wild-type control pigmented C57BL/6J, Slc38a8 heterozygous “HET” (+/–), and Slc38a8 homozygous mutant “HOM” (–/–). (A) Representative dark-adapted ERG intensity responses to single and double 1 log cd·s/m2 flashes from the three genotypes. (B, C) Luminance-response curves of the three experimental groups. Each graph includes measurements from scotopic mixed responses depicting a-wave (B) and b-wave (C) amplitudes. (D) Maximal scotopic cone-driven response from the three genotypes showing maximal a- and b-wave amplitudes. No statistically significant differences were found. (E) Left: Configuration of the optomotor system. Image was created using BioRender (https://biorender.com/). Right: Visual acuity measured as the spatial frequency threshold in the three experimental groups. Mean ± SEM, N = 5 to 8. Two-way ANOVA with Bonferroni correction (ERG) and Kruskal-Wallis test and Dunn's post hoc test (optomotor test). * P < 0.05, ** P < 0.01, Asterisks (*) refer to comparison between Slc38a8 heterozygous (+/–) and Slc38a8 homozygous (–/–) mice. Hash (#) refers to comparisons between control pigmented C57BL/6J and Slc38a8 homozygous (–/–) mice.

