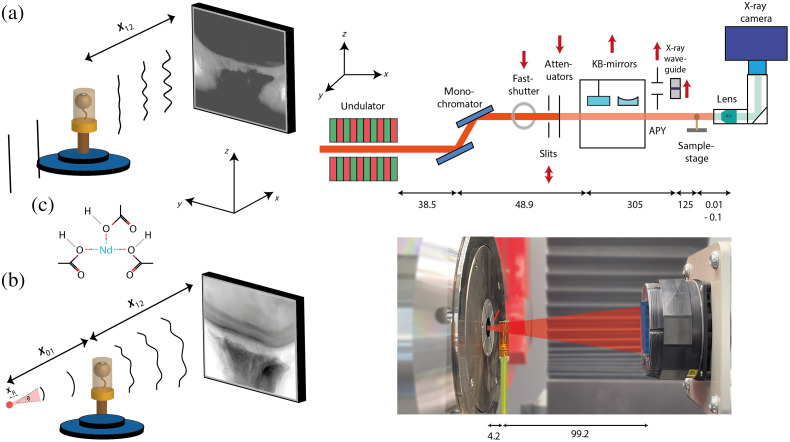
Fig. 1.
(a) Schematic overview of the parallel beam setup at the GINIX endstation with an attenuator in and KB-mirrors and X-ray waveguide out of the beam path (right). The propagated exit wave of a given sample projection impinges on the detector at a distance behind the sample, chosen to reach the holographic regime (left). (b) Laboratory nano-CT imaging setup with opening angle , a spatial coherence length . The ratio of source-to-sample () and sample-to-detector () distance (left) defines the magnification . Photo of laboratory setup (right): sample holder (green), beam (red), and detector area (blue). (c) 2D chemical structure of NdAc. A trivalent cation is coordinated by three acetate molecules that are formed by combination of acetic acid with a base. All lengths are in mm.

