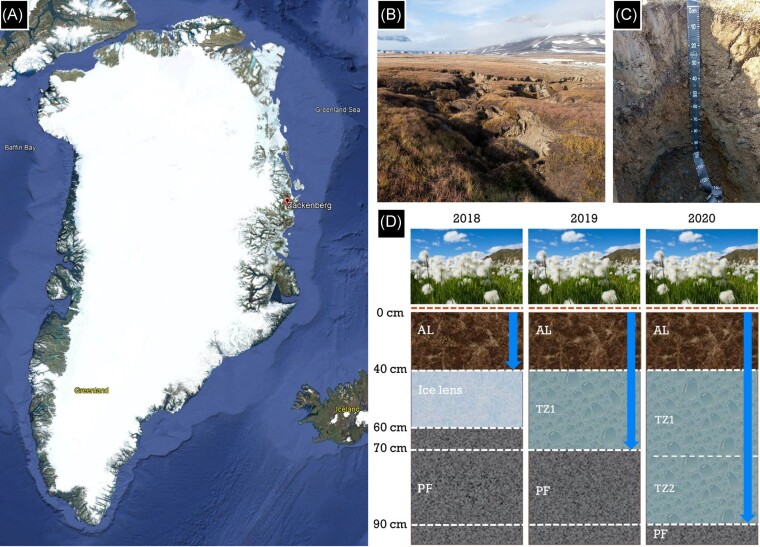
Figure 1.
(A) Sampling site Zackenberg in Northeast Greenland, credit: Google Earth. (B) Sampling site in 2018 after initial permafrost collapse. (C) Soil profile from the surface until still frozen depth at 90 cm during sampling in 2020. (D) Scheme of abrupt permafrost thaw (indicated with blue arrows), depicting the soil profile until the permafrost (PF) layer at 90‒100 cm depth from the moment of collapse in 2018 with visible ice lens below long-term active layer (AL) to the formation of transition zones (TZ = thawed permafrost).

