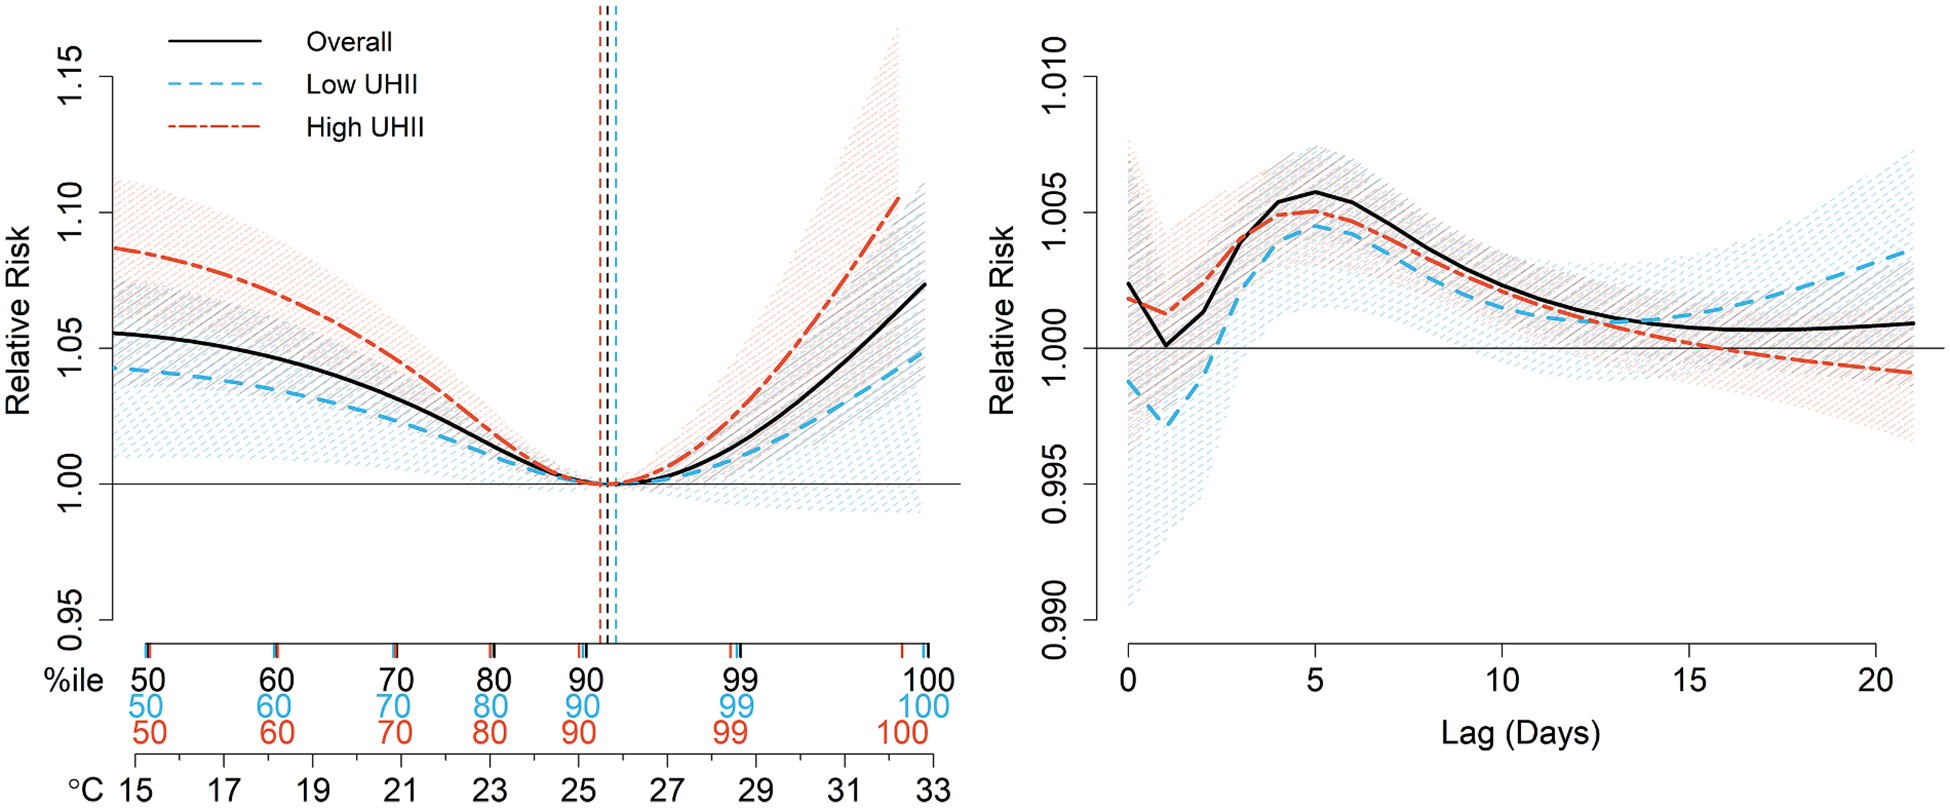
Fig. 3.

The 21-day cumulative exposure–response [left] and extreme heat (99th ambient temperature percentile) lag-response [right] associations between daily mean ambient temperature and daily hospitalizations for cardiovascular disease, overall and in low and high urban heat island intensity (UHII) areas. Results are shown for the entire study population across the urban cores of 120 metropolitan statistical areas in the contiguous US, 2000–2017. The vertical dashed lines indicate the location of the minimum hospitalization percentile.
