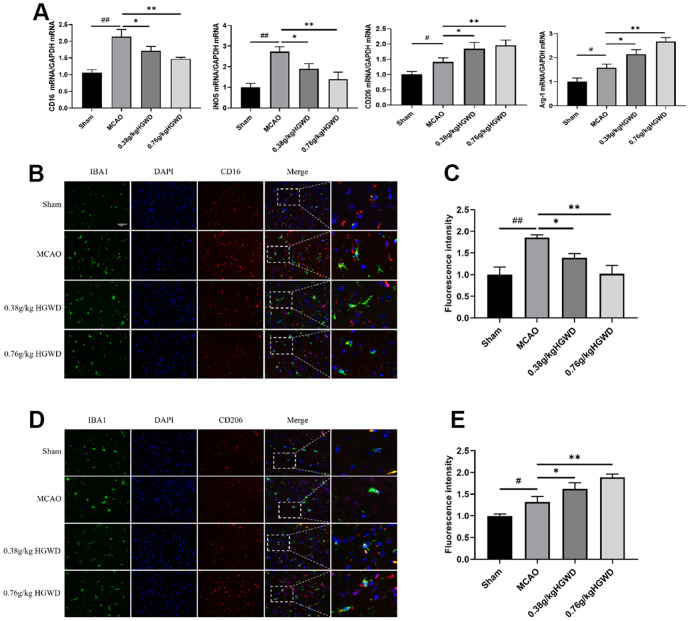
Figure 4.
HGWD promotes the M2 phenotype in microglia after ischemic stroke. (A) M1 marker (CD16 and iNOS) mRNA and M2 marker (CD206 and Arg-1) mRNA levels. (B) Representative double-immunofluorescence staining for CD16 (red) and Iba-1 (green) markers in hippocampus. (C) Quantification of the fluorescence intensity of CD16+/Iba-1+ cells. (D) Representative double-immunofluorescence staining for CD206 (red) and Iba-1 (green) markers in hippocampus. (E) Quantification of fluorescence intensity of CD206+/Iba-1+ cells. Scale bar: 50 μm. #P< 0.05, ##P < 0.01 vs. control group; *P< 0.05, **P< 0.01 vs. model group.

