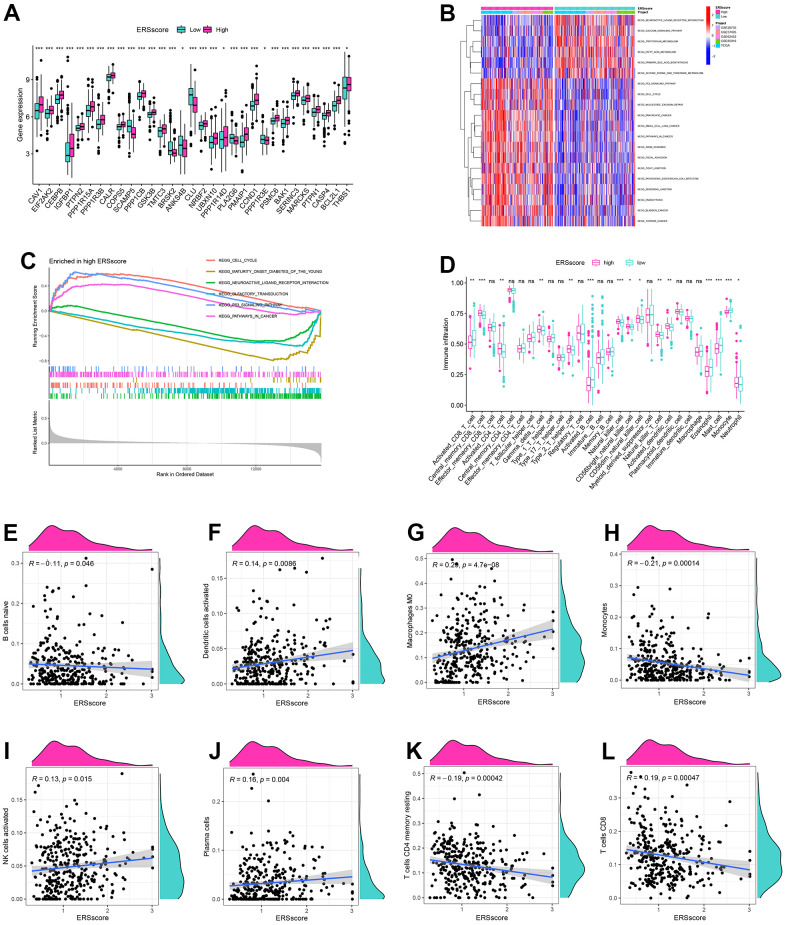
Figure 6.
GSVA, GSEA and immune analysis. (A) The expression difference of endoplasmic reticulum stress-related genes between high and low ERS score. (B) GSVA analysis. (C) GSEA analysis. (D) ssGSEA analysis. Correlation of naive B cells (E), activated dendritic cells (F), macrophages M0 (G), monocytes (H), activated NK cells (I), plasma cells (J), memory resting CD4+ T cells (K) and CD8+ T cells (L), and ERS score based around the CIBERSORT algorithm. (*p<0.05; **p<0.01; ***p<0.001).

