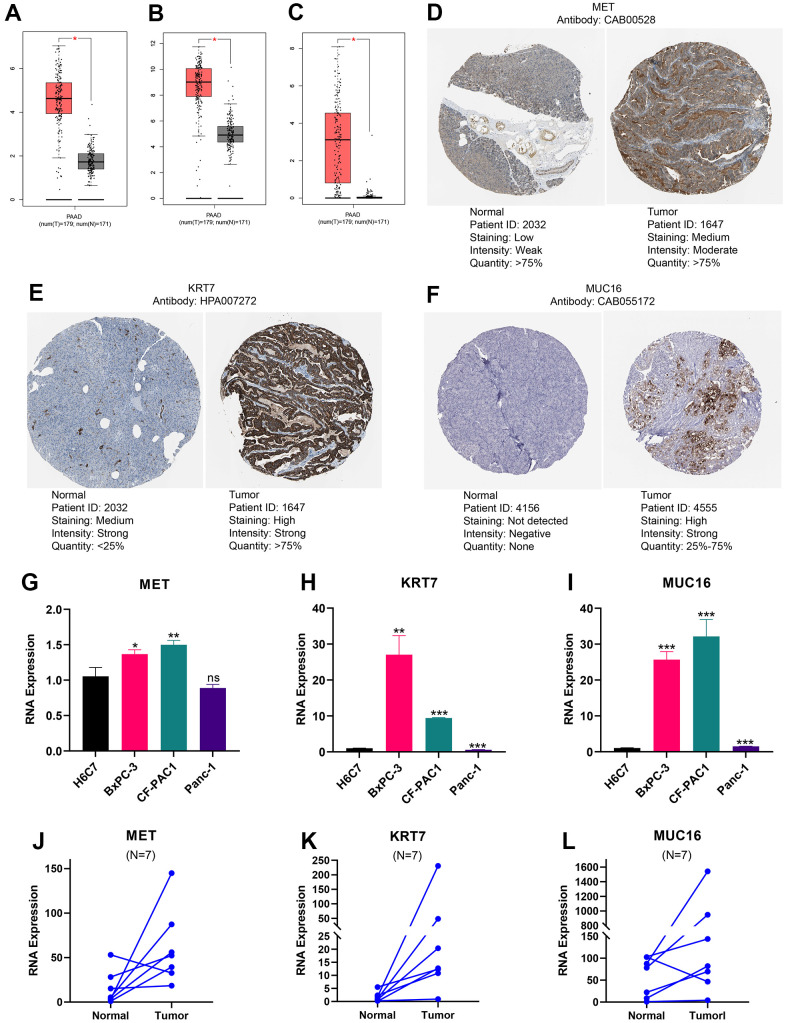
Figure 9.
Expression levels of MET, KRT7, and MUC16. The expression of MET (A), KRT7 (B), and MUC16 (C) at RNA level. Immunohistochemical images of MET (D), KRT7 (E), and MUC16 (F). The expression differences of MET (G), KRT7 (H), and MUC16 (I) between pancreatic ductal epithelium and pancreatic cancer cell lines. The expression difference of MET (J), KRT7 (K), and MUC16 (L) between pancreatic tumour and adjacent tissue. (*p<0.05; **p<0.01; ***p<0.001).

