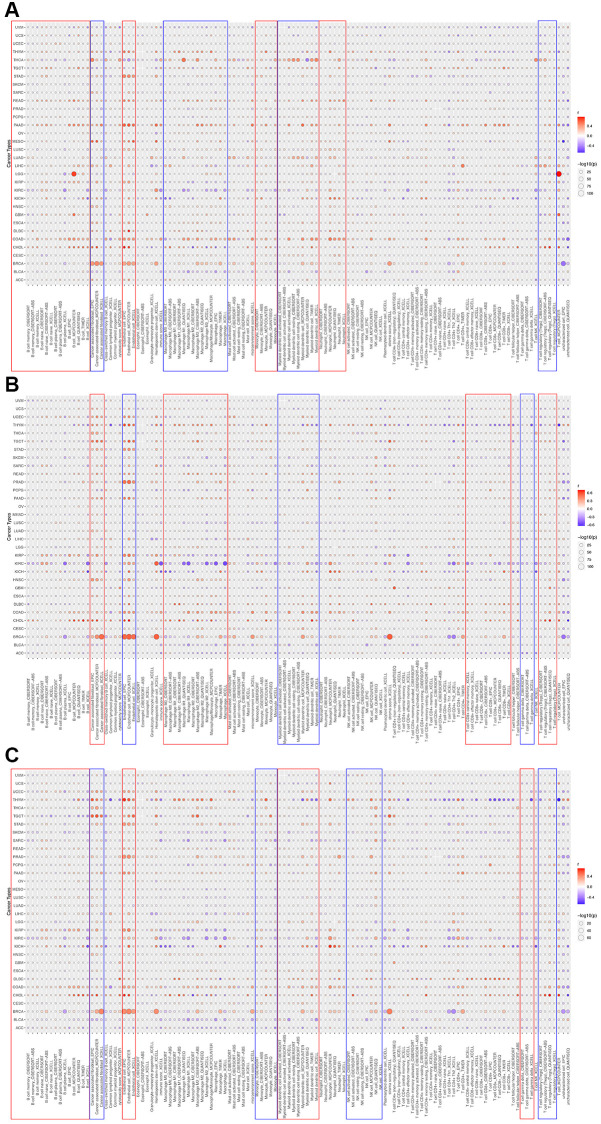
Figure 10.
The correlations of HOXD1 (A), HOXD3 (B), and HOXD4 (C) expression and the infiltration levels of CD4+ T cells, CAF, progenitor, Endo, Eos, HSC, Tfh, γδT, regulatory T cells (Tregs), B cells, neutrophils, monocytes, macrophages, dendritic cells, NK cells, Mast cells and CD8+ T cells in cancers.

