Figure 1.

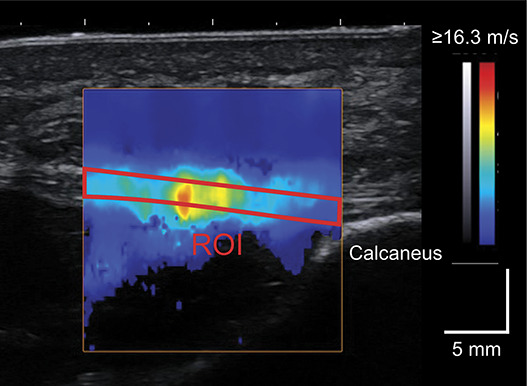
A representative shear wave image of the plantar fascia at the proximal site. The red outline bounds the region of interest (ROI).

A representative shear wave image of the plantar fascia at the proximal site. The red outline bounds the region of interest (ROI).