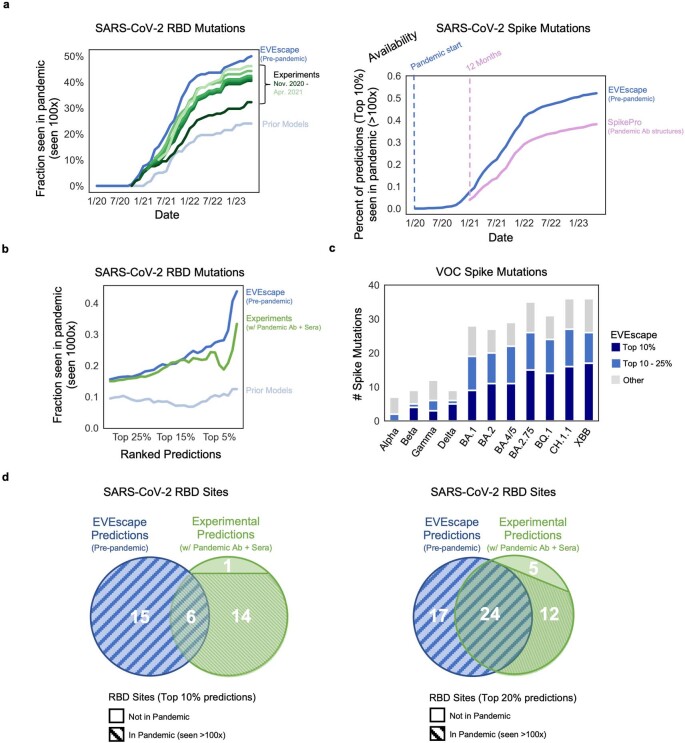
Extended Data Fig. 5. EVEscape as accurate as experimental scans at anticipating pandemic variation: retrospective analysis.
a) Top 10% of RBD escape predictions computed using either EVEscape, DMS experiments (Bloom Set, Table S4), or prior models42 seen by each date over 100 times in GISAID (left). DMS experiments are separated into which studies were available by each starting date. Top 10% of full Spike escape predictions computed using either EVEscape or prior SpikePro model18 seen by each date over 100 times in GISAID (right). b) Fraction of top mutations (at different percentage thresholds) predicted by EVEscape, DMS experiments, or prior models seen more than 1000 times in GISAID. c) The majority of Spike mutations in VOC strains have high EVEscape scores. d) Venn diagram comparing the top 10% (left) or 20% (right) of RBD sites predicted by EVEscape and by DMS experiments (Bloom Set Table S4). Each bin is stratified to indicate the number of sites observed >100 times over the full pandemic (stripe pattern). All sites in the top 20% of EVEscape predictions have been observed in the pandemic, and there is significantly more overlap between EVEscape and experiments when looking at the top 20% of their predictions as compared to the top 10%.

