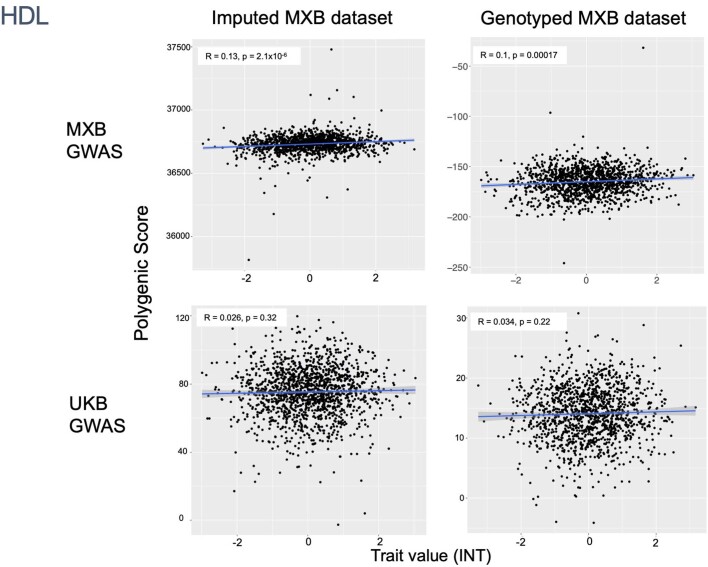
Extended Data Fig. 6. Prediction performance of MXB-GWAS-based or UKB-GWAS-based polygenic scores computed for HDL in the MXB.
Traits are inverse normalized. Prediction performance is measured by the correlation between polygenic score (the sum of all alleles associated at p < 0.1 weighted by their estimated effect sizes) and trait value (Pearson correlation R and associated two-sided p-value). Smoothed conditional mean lines are shown using a linear model. Error bands represent 95% confidence intervals.

