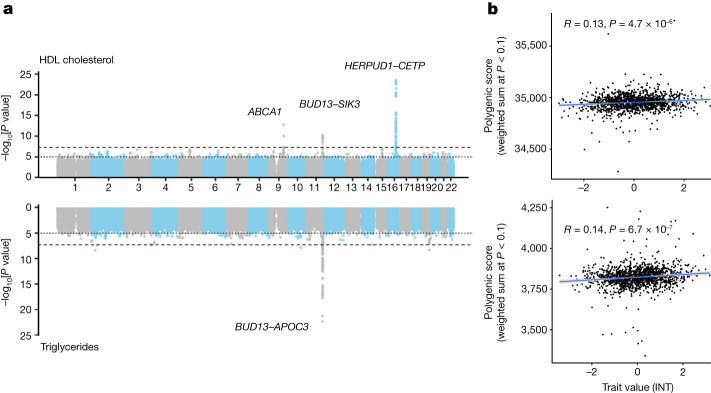
Fig. 4. Illustrative examples of GWAS and polygenic prediction in the MXB.
a, Manhattan plots showing GWAS results for HDL cholesterol (top, n = 4,484) and triglycerides (bottom, n = 4,483) in the full MXB dataset. Fine-mapped genes are labelled (Methods). To aid with visualization, 1 in 200 SNPs with P > 0.01 were sampled for the Manhattan plots. b, Prediction performance is measured by the correlation between polygenic score (the sum of all alleles associated at P < 0.1 weighted by their estimated effect sizes) and trait value (as measured by Pearson correlation R and its associated two-sided P value) for HDL cholesterol (top, n = 1,327) and triglycerides (bottom, n = 1,326). According to the schematic in Supplementary Fig. 41, for b, GWAS was carried out in two-thirds of the MXB, and the remaining one-third of the MXB was used to compute polygenic scores and test their ability to predict complex traits. Smoothed conditional mean lines are shown using a linear model. Error bands represent 95% confidence intervals. Scores were computed using TOPMed-imputed MXB genotypes. Traits were normalized using an inverse normal transform (INT) for both a and b. For further evaluation of prediction performance, see Extended Data Figs. 1b and 2–10 and Supplementary Tables 8 and 9.

