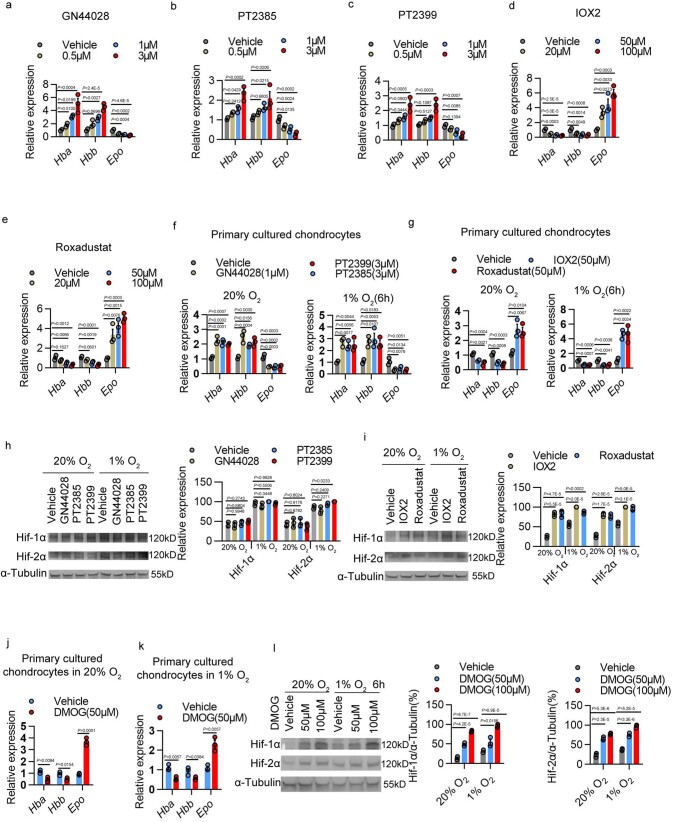
Extended Data Fig. 6. Effects of compounds regulating Hifs activity on hemoglobin expression.
a-e, Expression of Hba, Hbb and Epo mRNA of primary cultured chondrocytes in 20% O2 with increased dose of compounds targeting either Hif-1α or Hif-2α for 6 h. The inhibitor of Hif-1α: GN44028. The inhibitors of Hif-2α: PT2385 or PT2399. The activator of Hif-1α and Hif-2α: IOX2 or Roxadustat. n = 3 biologically independent experiments. f, g, Expression of Hba, Hbb and Epo mRNA of primary cultured chondrocytes in either 20% or 1% O2 with compounds targeting either Hif-1α or Hif-2α for 6 h. n = 3 biologically independent experiments. h, i, Quantification of Hif-1α or Hif-2α protein by Western blot analysis of total protein lysate extracted from primary cultured chondrocytes in either 20% or 1% O2 with compounds targeting either Hif-1α or Hif-2α for 6 h. A representative Western blot is shown on the left. Quantification of all biological replicates is provided on the right. Data for Hif-1α or Hif-2α were normalized to α-tubulin (n = 3 biologically independent experiments). For gel source data, see Supplementary Fig. 1f,g. j, k, Expression of Hba, Hbb and Epo mRNA of primary cultured chondrocytes in either 20% (j) or 1% (k) O2 with compound DMOG (50 μM), the activator of Hif-1α and Hif-2α for 6 h. n = 3 biologically independent experiments. l, Quantification of Hif-1α or Hif-2α protein by Western blot analysis of total protein lysate extracted from primary cultured chondrocytes in either 20% or 1% O2 with compound DMOG for 6 h. A representative Western blot is the left. Quantification of all biological replicates is provided on the right. Data for Hif-1α or Hif-2α were normalized to α-tubulin (n = 3 biologically independent experiments). For gel source data, see Supplementary Fig. 1h. Error bars represent SEM. P values were calculated using one-way ANOVA tests (a-i, l) or two-tailed Student’s t-test (j, k). The exact P-values of comparison are presented in the figures, respectively.

