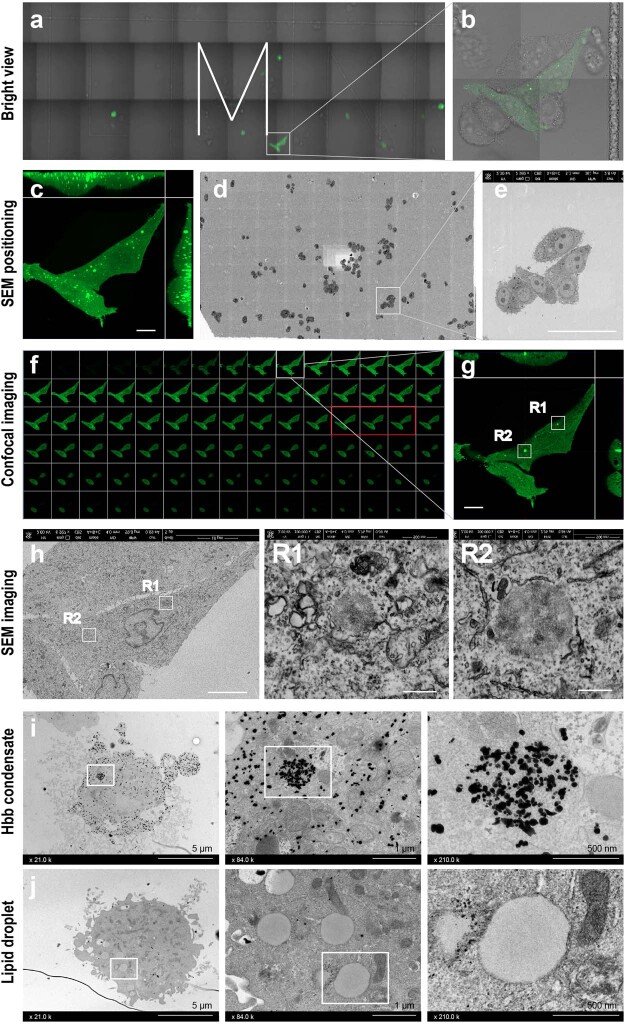
Extended Data Fig. 4. Identification of Hbb condensates by correlative light and electron microscopy and immune electron transmission microscopy.
a, Large field view of cells plated on grid glass bottom dish in merged bright and fluorescent channels. M marks the grid with cells of interest. b, zoom-in view of cells within the boxed region in (a). c, composite Z-stack view of cells expressing Hbb-EGFP in (b) by confocal microscopy. Scale bar: 10 μm. d, ultra-thin section image of cells within the field of (a) by scanning electron microscopy. e, zoom-in view of cells within the boxed region in (d). Scale bar: 50 μm. f, split confocal images for the cells of interest in (c) from a row of bottom-up with a Z-step of 0.15 μm. the images within red box are corresponding to the view in (e). g, zoom-in view of image within the boxed region in (f). Hbb-EGFP condensates are indicated as R1 and R2. Scale bar: 10 μm. h, scanning electron microscopy image (left) corresponding to the confocal image (g). Scale bar: 10 μm. R1 and R2 regions are displayed in the right in zoomed view. Scale bar: 500 nm. i, Hbb condensate identified by immune electron transmission microscopy. Boxed regions are zoomed in the right. Scale bars are indicated. j, Lipid droplets detected by electron transmission microscopy. Boxed regions are zoomed in the right. Scale bars are indicated.

