Fig. 5.
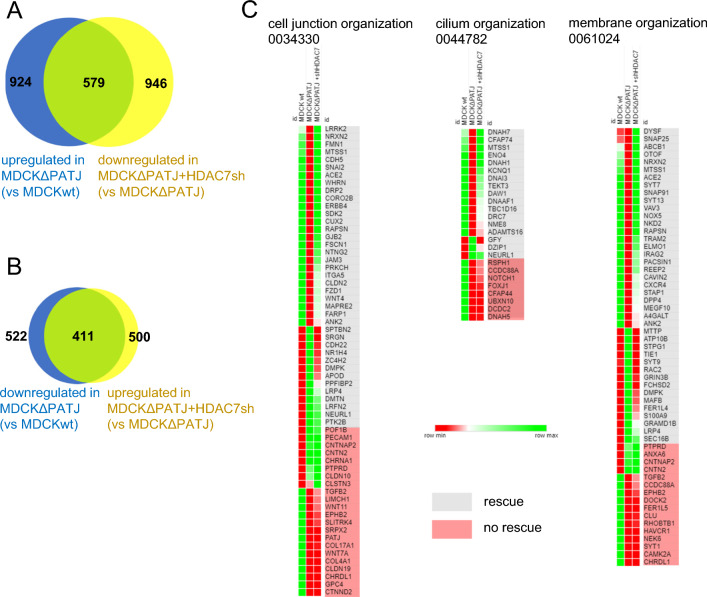
RNAseq analysis reveals HDAC7-dependent changes in the transcriptional profile. A, B Number of genes whose expressions were significantly (log2 fold change > 2) down-(A) or upregulated (B) in MDCK∆PATJ cells compared to wild-type MDCK cells (blue circle). Genes, which are up- (A) or downregulated (B) in MDCK∆PATJ + HDAC7-shRNA in comparison to MDCK∆PATJ are represented by yellow circle. Green represents genes, which are rescued in MDCK∆PATJ + HDAC7 shRNA cells. Sufficient rescue was assumed, if at least 25% of mRNA expression compared to wild type MDCK is restored. C Heat map of differentially regulated genes which are summarized in the indicated GO terms. Raw expression data are depicted according to the color code for wild-type MDCK (left row), MDCK∆PATJ (middle row) and MDCK∆PATJ + HDAC7 shRNA (right row). See also Fig. S4 for additional data

