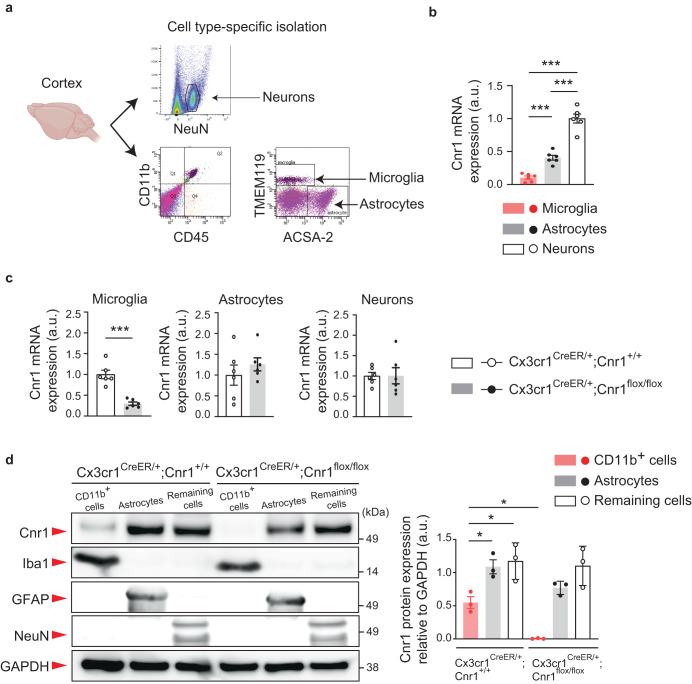
Fig. 1. Cnr1 expression in the microglia of the mouse brain.
a Experimental flow of Fluorescence-Activated Cell Sorting (FACS)-based microglia (CD45+CD11b+TMEM119+), astrocyte (ACSA-2+), and neuron (NeuN+) isolation using specific cell markers. b Relative mRNA expression levels (arbitrary units: a.u.) of Cnr1 in microglia, astrocytes, and neurons isolated from wild type mice were measured by quantitative real time PCR (qPCR) using the TaqMan assay protocol. n = 6 mice per group. ***p < 0.001, **p < 0.01 (p values are Microglia versus Astrocytes: p = 0.0010, Microglia versus Neurons: p < 0.0001, Astrocytes versus Neurons: p < 0.0001), determined by one-way ANOVA with post hoc Tukey test. c Relative mRNA expression levels (arbitrary units: a.u.) of Cnr1 in microglia, astrocytes, and neurons isolated from Cx3cr1CreER/+;Cnr1+/+ and Cx3cr1CreER/+;Cnr1flox/flox mice were measured by qPCR. n = 6 mice per group. ***p < 0.001 (p values are p < 0.0001), determined by unpaired two-tailed Student’s t test. d Microglia-enriched CD11b+ cells, ACSA-2+ astrocytes, and remaining cells including neurons were collected from the cerebral cortex of Cx3cr1CreER/+;Cnr1flox/flox mice and littermate controls (Cx3cr1CreER/+;Cnr1+/+) by magnetic activated cell sorting (MACS). For each cell type, expression of Cnr1, marker proteins (Iba1, GFAP, NeuN) and a loading control (GAPDH) in the total protein (arbitrary units: a.u.) were analyzed with SDS-PAGE followed by Western blotting with 10 μg of protein sample loaded in each well. n = 3 mice per group. *p < 0.05 (p values are Cnr1+/+ Cd11b+ cells versus Cnr1+/+ Astrocytes: p = 0.0495, Cnr1+/+ Cd11b+ cells versus Cnr1+/+ Remaining cells: p = 0.0204, Cnr1+/+ Cd11b+ cells versus Cnr1flox/flox Cd11b+ cells: p = 0.0479), determined by two-way ANOVA with post hoc Tukey test. b–d Each symbol represents one animal. Data are presented as the mean ± s.e.m.

