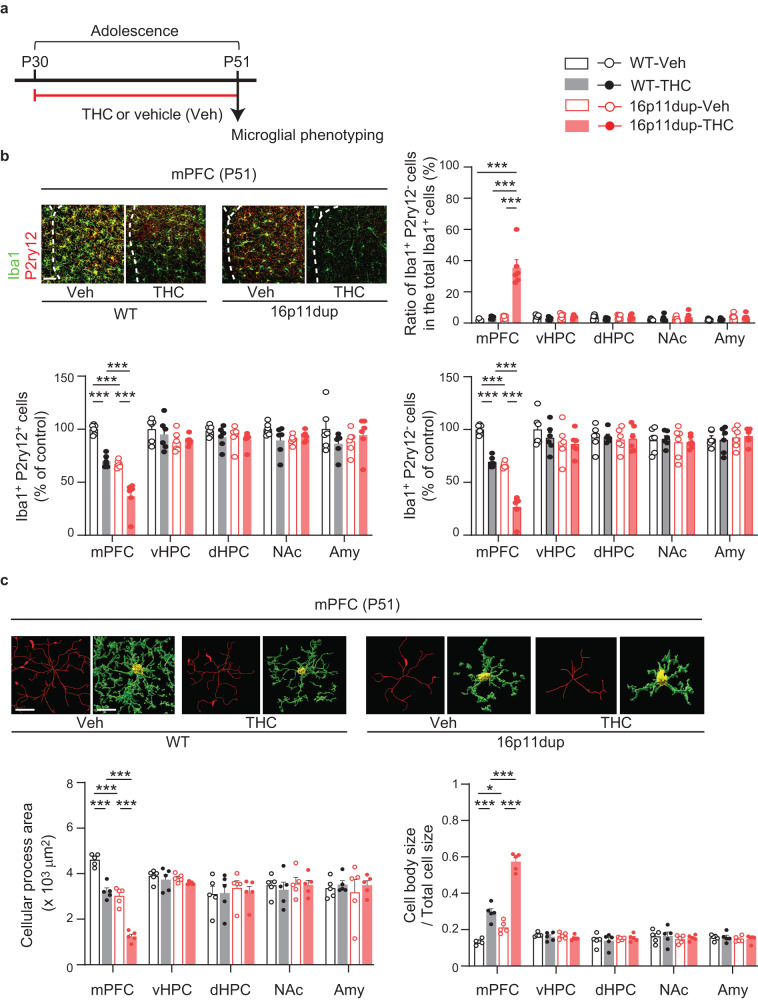
Fig. 2. Microglial changes in the mPFC of 16p11dup male mice produced by adolescent THC treatment.
a Schematic diagram of the adolescent THC treatment protocol. 16p11dup mice and wild type littermate controls (WT) were treated with THC or vehicle (Veh) during adolescence, followed by microglial phenotyping at P51 upon completion of THC treatment. b (Top left) Immunohistochemistry of Iba1 (green) and P2ry12 (red) in the medial prefrontal cortex (mPFC) at P51. Scale bar, 50 μm. (Top right) The percentage of Iba1+P2ry12− cells among all Iba1+ cells in the mPFC, ventral hippocampus (vHPC), dorsal hippocampus (dHPC), nucleus accumbens (NAc), and amygdala (Amy). (Bottom left) The number of Iba1+P2ry12+ cells and (bottom right) Iba1+P2ry12− cells in these brain regions, presented as % of control (n = 6 slices in 3 mice per condition). c Microglial morphology analysis of individual Iba1+ cells in these brain regions. (Top) Representative tracing images (red) along with images of cellular processes (green) and cell bodies (yellow) of Iba1+ cells. Scale bar, 10 μm. (Bottom left) Quantification of cellular process area of Iba1+ cells (n = 50 cells in 5 mice per condition). (Bottom right) Quantification of the ratio of cell body size to total cell size of Iba1+ cells (n = 50 cells in 5 mice per condition). ***p < 0.001, *p < 0.05 (p values are (b) (Top right) all: p < 0.0001, (Bottom left) all: p < 0.0001, (Bottom right) all: p < 0.0001, (c) (Left) all: p < 0.0001, (Right) WT-Veh versus WT-THC: p < 0.0001, WT-Veh versus 16p11dup-Veh: p = 0.0229, WT-THC versus 16p11dup-THC: p < 0.0001, 16p11dup-Veh versus 16p11dup-THC: p < 0.0001), determined by two-way ANOVA with post hoc Tukey test. Each symbol represents one slice (b) and one animal (c). Data are presented as the mean ± s.e.m.

