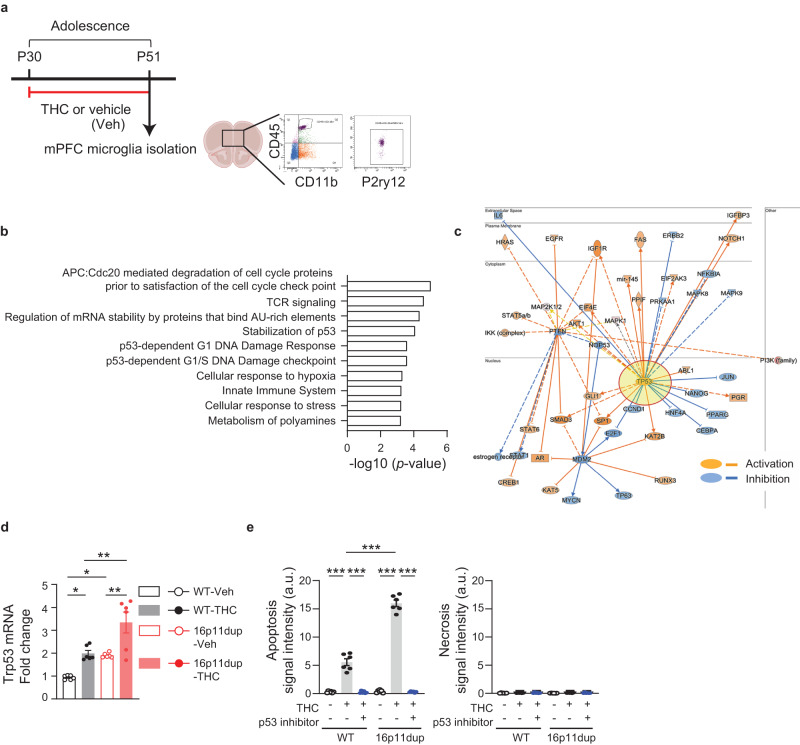
Fig. 4. Up-regulation of p53 signaling pathway identified by mPFC microglia-specific transcriptome profiling.
a Experimental flow of Fluorescence-Activated Cell Sorting (FACS)-based mPFC microglia isolation by using 3 markers (CD45/CD11b/P2ry12) at P51, followed by RNA sequencing (RNA-seq). b Significantly enriched pathways of genes associated (two-tailed uncorrected p < 0.05) with the 16p11dup with THC condition compared to control, in the Reactome Pathway analysis. c Functional gene interaction network from the upstream regulators/Ingenuity Pathway Analysis (IPA) for the genes associated with the 16p11dup with THC treatment condition showing predicted inhibition (blue), activation (orange), and unknown directionality (gray). d Relative mRNA expression level of Trp53 in microglia isolated from mPFC at P51. n = 6 mice per condition. e Apoptosis (left) and necrosis (right) assays using primary microglia cultures treated by THC or vehicle (Veh) with and without pifithrin-α. (Left) Quantification of signal intensity (arbitrary units: a.u.) of apopxin. n = 6 fields in 3 mice per condition. (Right) Quantification of signal intensity (arbitrary units: a.u.) of 7-AAD. n = 6 fields in 3 mice per condition. d, e ***p < 0.001, **p < 0.01, *p < 0.05 (p values are (d) WT- Veh versus WT-THC: p = 0.0270, p values are WT-Veh versus 16p11dup-Veh: p = 0.0465, WT-THC versus 16p11dup-THC: p = 0.0037, 16p11dup-Veh versus 16p11dup-THC: p = 0.0021, (e) all: p < 0.0001), determined by two-way ANOVA with post hoc Tukey test. Each symbol represents one animal (d) and one field (e). Data are presented as the mean ± s.e.m.

