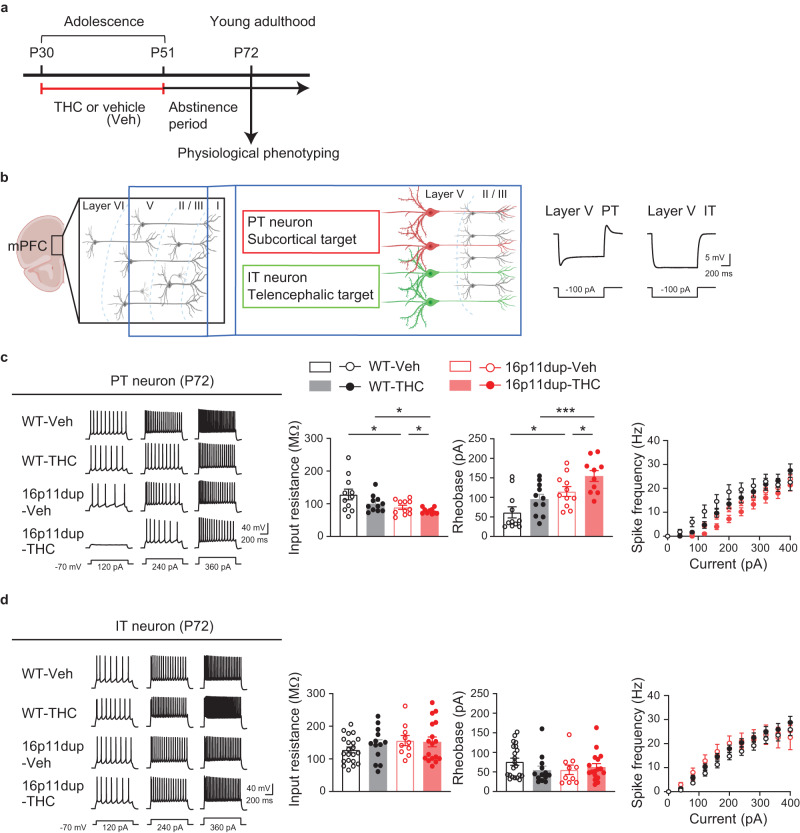
Fig. 6. Synergistic reduction in intrinsic excitability in PT neurons produced by adolescent THC and 16p11dup.
a Schematic diagram of the adolescent THC treatment protocol. b (Left) Schematic structure of multiple layers of the mPFC. Pyramidal tract (PT, red) and intra-telencephalic (IT, green) neurons in layer 5 of the mPFC are depicted. (Right) Representative voltage traces elicited by applying −100 pA current steps. These traces show typical hyperpolarizing responses of PT and IT neurons. c (Left) Representative voltage traces recorded from PT neurons in response to current step injections. (Right) The intrinsic excitability assessed by measurement of input resistance (left), rheobase (middle), and spike frequency (right). WT-Veh (n = 11 cells in 6 mice), WT-THC (n = 11 cells in 7 mice), 16p11dup-Veh (n = 11 cells in 6 mice), and 16p11dup-THC (n = 10 cells in 5 mice). d (Left) Representative voltage traces recorded from IT neurons in response to current step injections. (Right) The intrinsic excitability assessed by measurement of input resistance (left), rheobase (middle), and spike frequency (right). WT-Veh (n = 21 cells in 8 mice), WT-THC (n = 13 cells in 7 mice), 16p11dup-Veh (n = 10 cells in 6 mice), and 16p11dup-THC (n = 17 cells in 7 mice). c ***p < 0.001, **p < 0.01, *p < 0.05 (p values are (Left) WT-Veh versus 16p11dup-Veh: p = 0.0395, WT-THC versus 16p11dup-THC: p = 0.0394, 16p11dup-Veh versus 16p11dup-THC: p = 0.0406, (Right) WT-Veh versus 16p11dup-Veh: p = 0.0463, WT-THC versus 16p11dup-THC: p = 0.0004, 16p11dup-Veh versus 16p11dup-THC: p = 0.0368), determined by two-way ANOVA with post hoc Tukey test. Each symbol represents one cell. Data are presented as the mean ± s.e.m.

