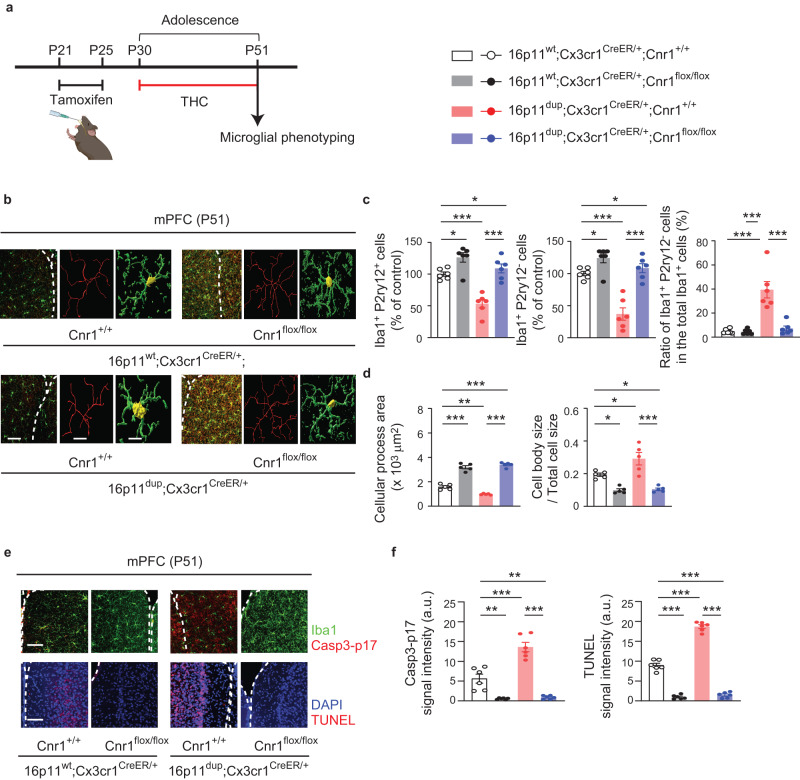
Fig. 7. Cnr1 deletion in the microglia normalizes microglial abnormalities produced by adolescent THC treatment and 16p11dup.
a Schematic diagram of the experimental design. b Immunohistochemical analysis of Iba1 (green) in the mPFC at P51. (Left) Representative images of the mPFC, representative tracing images (red), and images of cellular processes (green) and cell bodies (yellow) of Iba1+ cells. Scale bar, 50 μm (left) and 10 μm (middle and right). c The number of Iba1+P2ry12+ cells (left) and Iba1+P2ry12− cells (middle) in the mPFC, presented as % of control. (Right) The percentage of Iba1+P2ry12− cells among all Iba1+ cells in the mPFC. (n = 6 slices in 3 mice per condition). d Quantification of the ratio of cellular process area (left) and cell body size to total cell size (right) of Iba1+ cells. (n = 50 cells in 5 mice per condition). e Representative images of immunohistochemistry of Iba1 (green) and Casp3-p17 (red) (top left) as well as TUNEL signals (red) and DAPI (blue) (bottom left) in the mPFC at P51. Scale bar, 50 μm. f Quantification of signal intensity of Casp3-p17 in Iba1+ cells (left) and TUNEL (right). n = 6 slices in 3 mice per condition. c, d, f ***p < 0.001, **p < 0.01, *p < 0.05 (p values are (c) (Left) 16p11wt;Cnr1+/+ versus 16p11wt;Cnr1flox/flox: p = 0.0281, 16p11wt;Cnr1+/+ versus 16p11dup;Cnr1+/+: p = 0.0001, 16p11wt;Cnr1+/+ versus 16p11dup;Cnr1flox/flox: p = 0.0221, 16p11dup; Cnr1+/+ versus 16p11dup;Cnr1flox/flox: p < 0.0001, (Middle) 16p11wt;Cnr1+/+ versus 16p11wt;Cnr1flox/flox: p = 0.0285, 16p11wt;Cnr1+/+ versus 16p11dup;Cnr1+/+: p < 0.0001, 16p11wt;Cnr1+/+ versus 16p11dup;Cnr1flox/flox: p = 0.0337, 16p11dup; Cnr1+/+ versus 16p11dup;Cnr1flox/flox: p < 0.0001, (Right) all: p < 0.0001, (d) (Left) 16p11wt;Cnr1+/+ versus 16p11wt;Cnr1flox/flox: p < 0.0001, 16p11wt;Cnr1+/+ versus 16p11dup;Cnr1+/+: p = 0.0017, 16p11wt; Cnr1+/+ versus 16p11dup;Cnr1flox/flox: p < 0.0001, 16p11dup;Cnr1+/+ versus 16p11dup;Cnr1flox/flox: p < 0.0001, (Right) 16p11wt;Cnr1+/+ versus 16p11wt;Cnr1flox/flox: p = 0.0225, 16p11wt;Cnr1+/+ versus 16p11dup;Cnr1+/+: p = 0.0183, 16p11wt;Cnr1+/+ versus 16p11dup;Cnr1flox/flox: p = 0.0330, 16p11dup;Cnr1+/+ versus 16p11dup;Cnr1flox/flox: p < 0.0001, (f) (Left) 16p11wt;Cnr1+/+ versus 16p11wt;Cnr1flox/flox: p = 0.0016, 16p11wt;Cnr1+/+ versus 16p11dup;Cnr1+/+: p < 0.0001, 16p11wt;Cnr1+/+ versus 16p11dup;Cnr1flox/flox: p = 0.0032, 16p11dup;Cnr1+/+ versus 16p11dup;Cnr1flox/flox: p < 0.0001, (Right) all: p < 0.0001), determined by two-way ANOVA with post hoc Tukey test. Each symbol represents one slice (a, f) and one animal (d). Data are presented as the mean ± s.e.m.

