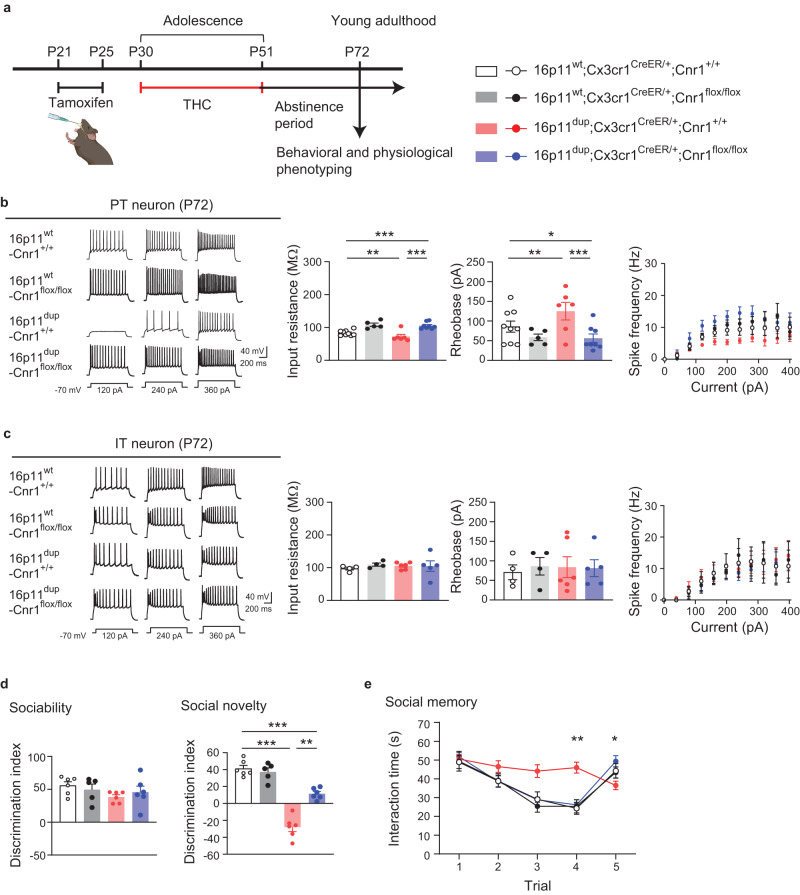
Fig. 8. Cnr1 deletion in the microglia normalizes deficits in PT neurons and social memory that are synergistically produced by adolescent THC treatment and 16p11dup.
a Schematic diagram of the experimental design. b (Left) Representative voltage traces recorded from PT neurons in response to current step injections. (Right) The intrinsic excitability of PT neurons, as quantified by input resistance (left), rheobase (middle), and spike frequency (right). 16p11wt;Cnr1+/+ (n = 9 cells in 2 mice), 16p11wt;Cnr1flox/flox (n = 5 cells in 3 mice), 16p11dup;Cnr1+/+ (n = 6 cells in 2 mice), and 16p11dup;Cnr1flox/flox (n = 8 cells in 3 mice). ***p < 0.001, **p < 0.01, *p < 0.05 (p values are (Left) 16p11wt;Cnr1+/+ versus 16p11dup;Cnr1+/+: p = 0.0042, 16p11wt;Cnr1+/+ versus 16p11dup;Cnr1flox/flox: p = 0.0001, 16p11dup;Cnr1+/+ versus 16p11dup;Cnr1flox/flox: p < 0.0001, (Right) 16p11wt;Cnr1+/+ versus 16p11dup;Cnr1+/+: p = 0.0016, 16p11wt;Cnr1+/+ versus 16p11dup;Cnr1flox/flox: p = 0.0396, 16p11dup;Cnr1+/+ versus 16p11dup;Cnr1flox/flox: p < 0.0001 determined by two-way ANOVA with post hoc Tukey test. c (Left) Representative voltage traces recorded from IT neurons in response to current step injections. (Right) The intrinsic excitability of IT neurons, as quantified by input resistance (left), rheobase (middle), and spike frequency (right). 16p11wt;Cnr1+/+ (n = 4 cells in 2 mice), 16p11wt;Cnr1flox/flox (n = 4 cells in 2 mice), 16p11dup;Cnr1+/+ (n = 6 cells in 2 mice), and 16p11dup;Cnr1flox/flox (n = 5 cells in 2 mice). d Sociability phenotypes (left) and preference of social novelty (right) as indicated by the discrimination index in the three-chamber social interaction test. e, Time spent with an ovariectomized female mouse in the 5-trial social memory test. d, e 16p11wt;Cnr1+/+ (n = 6 mice), 16p11wt;Cnr1flox/flox (n = 5 mice), 16p11dup;Cnr1+/+ (n = 6 mice), 16p11dup;Cnr1flox/flox (n = 6 mice). d, e ***p < 0.001, **p < 0.01 (p values are (d) 16p11wt;Cnr1+/+ versus 16p11dup;Cnr1+/+: p < 0.0001, 16p11wt;Cnr1+/+ versus 16p11dup;Cnr1flox/flox: p = 0.0004, 16p11dup;Cnr1+/+ versus 16p11dup;Cnr1flox/flox: p = 0.0026, (e) Cnr1flox/flox x 16p11dup interaction for Trial 4 [F1,19 = 11.30, p = 0.0033], Cnr1flox/flox x 16p11dup interaction for Trial 5 [F1,19 = 4.760, p = 0.0419]), determined by two-way ANOVA with post hoc Tukey test. Each symbol represents one cell (b, c) and one animal (d, e). Data are presented as the mean ± s.e.m.

