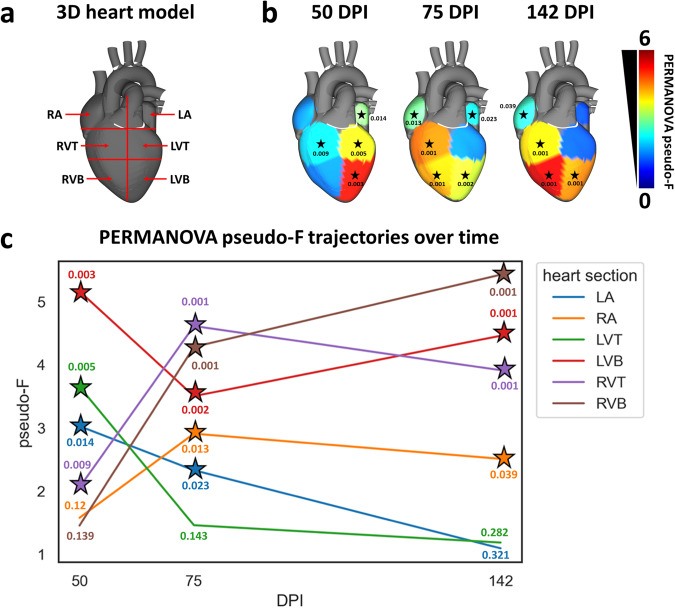
Fig. 1. Infection-induced small molecule perturbations are highly localized spatially and temporally.
a Heart sections analyzed. RA right atrium, LA left atrium, RVT right ventricle top, RVB right ventricle bottom, LVT left ventricle top, LVB left ventricle bottom. b PERMANOVA pseudo-F for PCoA distances between naïve and infected at 50, 75, and 142 days post-infection (DPI). *p-value < 0.05 by PERMANOVA. Pseudo-F is a measure of effect size: the greater the pseudo-F value, the greater the difference between infected and uninfected samples at that site and at that timepoint. c Site-specific PERMANOVA pseudo-F vs time. Star, p-value < 0.05 by PERMANOVA. Pseudo-F values increase between 75 and 142 DPI for left ventricle bottom and right ventricle bottom, indicating increasing impacts of infection on the overall small molecule profile. In contrast, pseudo-F values decrease between 75 and 142 DPI for all other tissue sections, indicating decreasing differences between infected and uninfected samples at these sites and these timepoints. N = 15 mice per group and per position. Source data are provided as a Source Data file.

