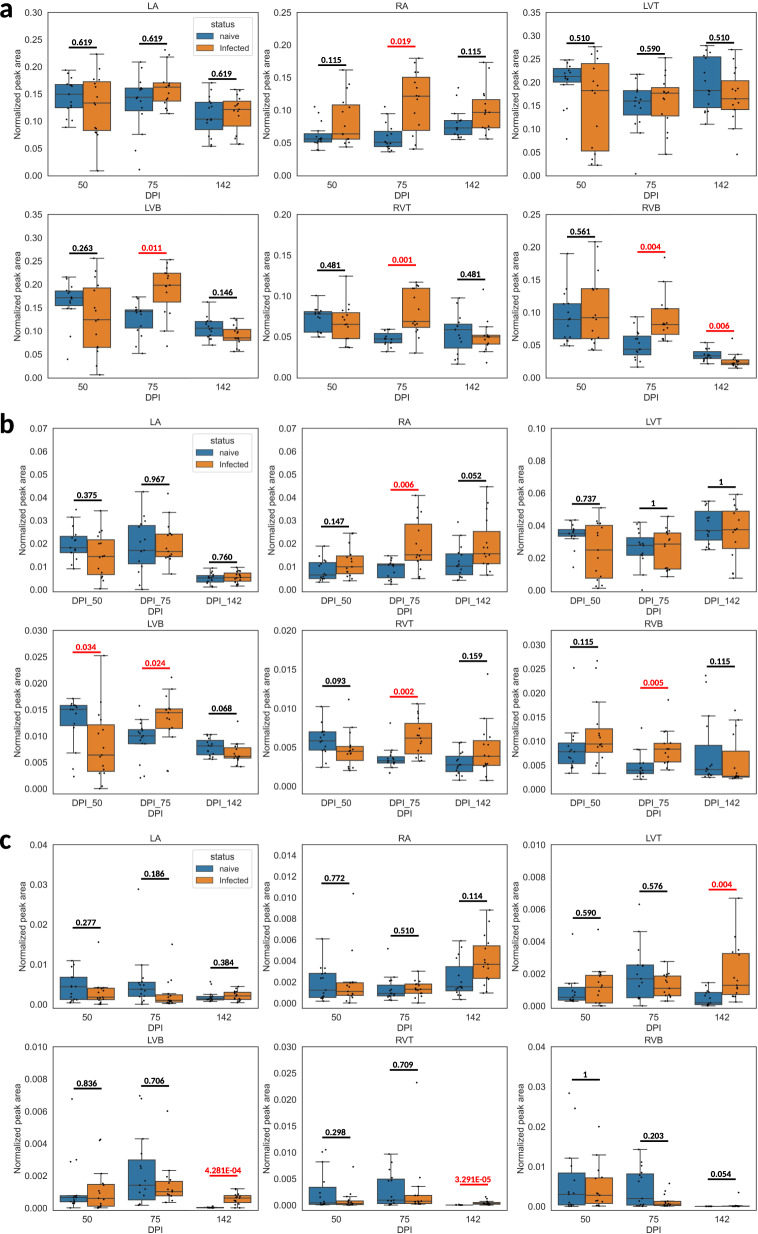
Fig. 3. Impact of infection duration on total glycerophosphocholines, glycerophosphoethanolamines and acylcarnitines.
Data represents summed peak areas for all glycerophosphocholines (a), all glycerophosphoethanolamines (b), and all acylcarnitines (c). identified as described in “Methods” section. RA right atrium, LA left atrium, RVT right ventricle top, RVB right ventricle bottom, LVT left ventricle top, LVB left ventricle bottom, DPI days post-infection. Red line, p-value < 0.05 by Mann-Whitney U test, two-sided, FDR-corrected. Black line, p-value > 0.05 by Mann-Whitney U test, two-sided, FDR-corrected. Numbers on top of the lines are the corrected p-values. Boxplots represent median, upper and lower quartiles, with whiskers extending to show the rest of the distribution, except for points that are determined to be outliers by being beyond the interquartile range ±1.5 times the interquartile range. N = 15 mice per group and per position. Source data are provided as a Source Data file.

