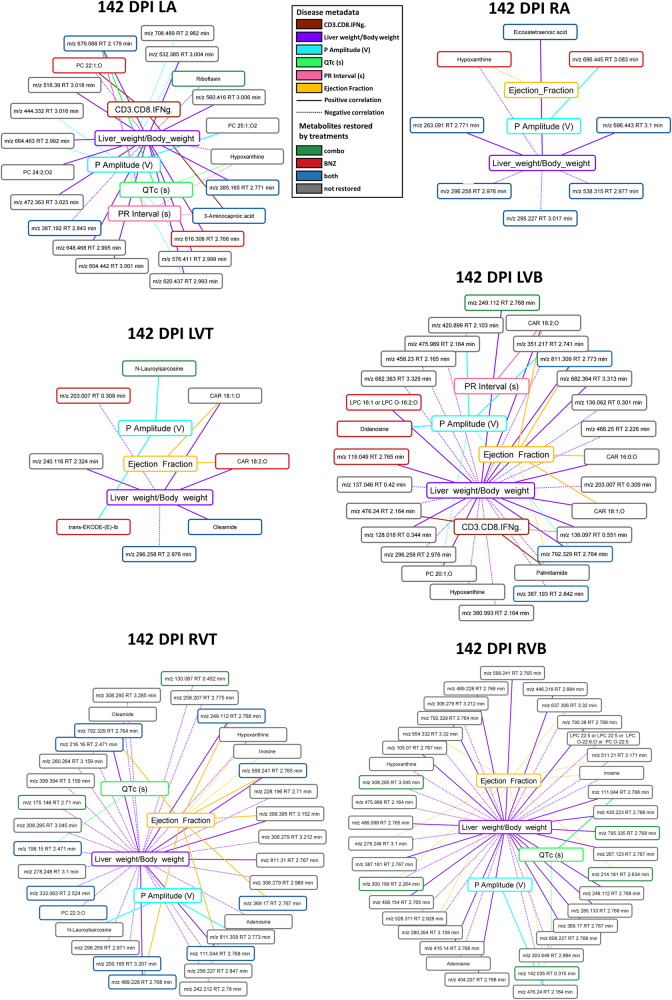
Fig. 6. Correlation between disease metadata and small molecule peak area at 142 DPI.
Solid lines indicate a positive correlation coefficient between disease metadata and small molecules; dotted lines indicate a negative correlation coefficient between disease metadata and small molecules. Correlation line colors relate to the specific correlated metadata category. Small molecule box colors indicate feature restoration status: green for features restored by combination treatment, red for features restored by BNZ treatment, blue for features restored by both treatments, and gray for features not restored by any treatment. Note the greater number of not-restored features correlated to the metadata. RA right atrium, LA left atrium, RVT right ventricle top, RVB right ventricle bottom, LVT left ventricle top, LVB left ventricle bottom, DPI days post-infection. N = 15 mice per group and per position. Source data are provided as a Source Data file.

