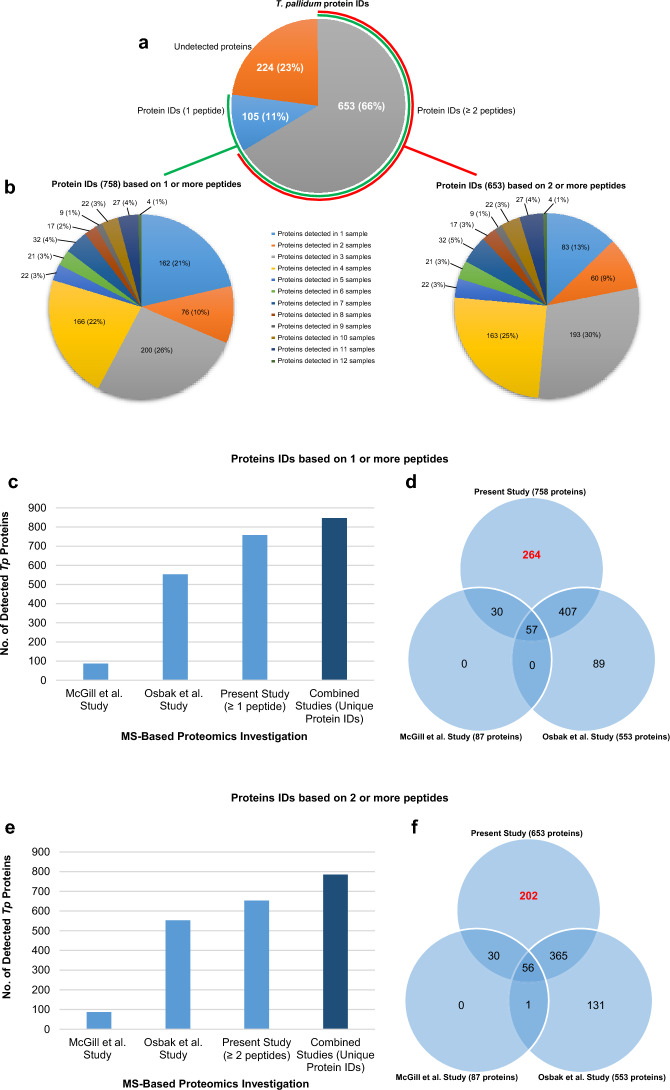
Figure 2.
In-depth proteome coverage of in vivo-grown T. pallidum and enhancement of the total combined proteome coverage. (a) Pie chart depicting the total T. pallidum proteome coverage obtained by combining all protein identifications from each of the 12 in vivo-grown biological replicate samples. The total number of treponemal proteins that were identified based on the detection of either one tryptic peptide or at least two tryptic peptides is shown (corresponding proteome coverages are indicated in parentheses). (b) Pie charts showing the distribution of protein identification frequencies for the 758 T. pallidum proteins that were identified based on the detection of one or more peptides (left) and for the 653 treponemal proteins that were identified based on the detection of at least two peptides (right). Values in parentheses indicate the percentage of T. pallidum proteins found in each of the 12 identification frequency groups. (c, e) Bar graphs showing the total number of T. pallidum proteins from in vivo-grown samples that were detected in the present study with at least one (c) or at least two (e) tryptic peptides and the numbers from previous mass spectrometry-based proteomics investigations (light blue bars). The combined total number of T. pallidum proteins identified in the three investigations is also shown (dark blue bar). (d, f) Venn diagrams showing the total number of shared and exclusive protein identifications in the three mass spectrometry-based proteomics investigations. The total number of T. pallidum proteins identified solely in the current study with at least one (d) or at least two (f) tryptic peptides are highlighted in red text.

