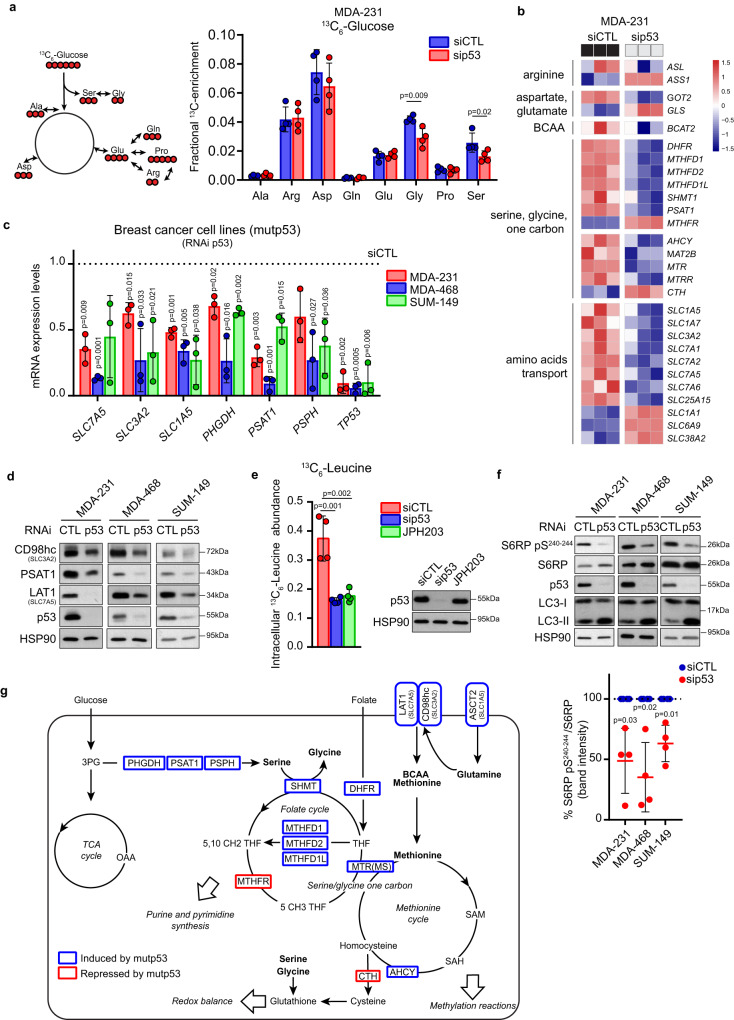
Fig. 1. Mutp53 promotes a specific AA metabolic program.
a Left panel: scheme of glucose-derived AAs where glucose-derived carbons are indicated in red. Right panel: mass isotopomer distribution (MID) of AAs from [U-13C6]-glucose in MDA-MB 231 cells upon control (siCTL) or p53 (sip53) silencing (isotopomers displayed in the scheme are those reported in the graph). For labeling experiments, cells were transfected with control or p53 siRNAs on the day of seeding and cultivated for 24 h followed by incubation with [U-13C6]-glucose in the medium for additional 24 h; n = 4 biological replicates. b Heatmap of RNA-seq data of genes related to AA biosynthesis, intake, and metabolism in MDA-MB 231 cells upon control (siCTL) or p53 (sip53) silencing. Three columns for each condition represent n = 3 biological replicates. c qRT-PCR analysis of indicated genes in MDA-MB 231, MDA-MB 468, and SUM-149 cells upon silencing of p53. mRNA levels relative to control condition (dotted line) are shown; n = 3 biological replicates. d Western blot analysis of indicated proteins in MDA-MB 231, MDA-MB 468, and SUM-149 cells upon silencing of p53. CD98hc is encoded by SLC3A2 and LAT1 by SLC7A5. HSP90 was used as loading control; n = 3. e Left panel: intracellular level of 13C6-Leucine (Mass isotopomer distribution (MID) of M6 Leucine) in MDA-MB 231 cells upon control (siCTL) or p53 (sip53) silencing and treated with 10 μM JPH203 (LAT1i) as a positive control. Right panel: western blot analysis of p53 levels in the above-described condition. HSP90 was used as loading control; n = 4 biological replicates. f Upper panel: western blot analysis of indicated proteins in MDA-MB 231, MDA-MB 468, and SUM-149 cells upon silencing of p53. HSP90 was used as loading control. Lower panel: quantification of depicted western blot bands expressed as percentage of S6RP pS240-244 relative to S6RP; n = 4 biological replicates. g Schematic overview of genes encoding for AA enzymes and transporters downregulated (blue) and upregulated (red) upon silencing of mutp53. Graph bars represent mean±s.d. Two-tailed Student’s t-test or Exact test p-value (FDR) cutoff 0.05. Source data are provided as a Source Data file.

