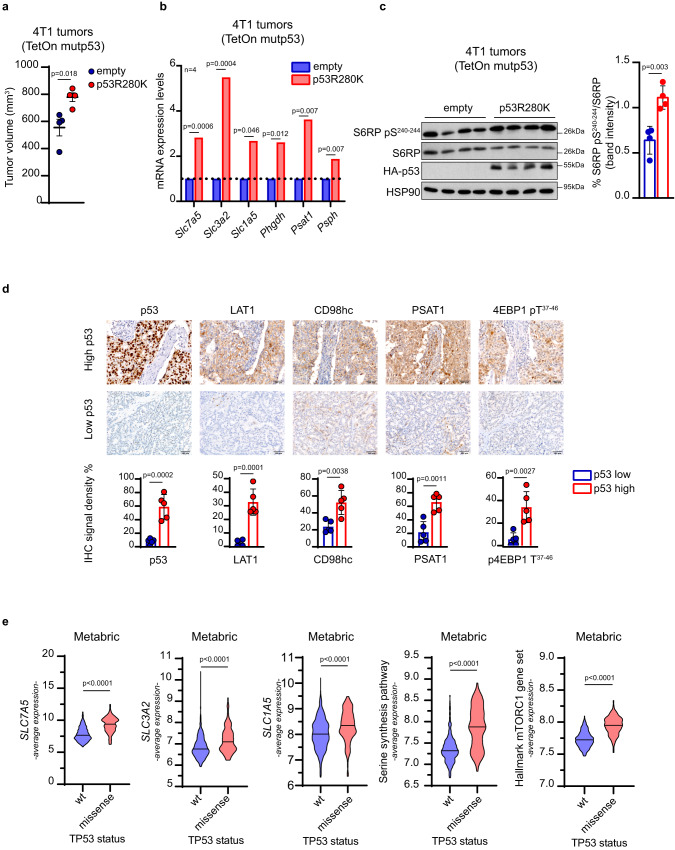
Fig. 2. BCs with mutp53 express higher levels of SSP enzymes, LAT1, and mTORC1 activation.
a Quantification of tumor volume in mice injected with indicated 4T1 TetOn inducible clones at day 24; n = 4/condition. b qRT-PCR analysis of the indicated genes in 4T1 TetOn clones used in (a); n = 4/condition. c Left panel: western blot analysis of the indicated proteins in lysates of tumor samples from (a). HSP90 was used as loading control. Right panel: quantification of depicted western blot bands expressed as percentage of S6RP pS240-244 relative to S6RP. In vivo data (a) are shown as mean ± SE. In scatter dot plots, each dot represents one mouse. Graph bars in b represent mean of n = 4 mice per group. Graph bars in c represent mean ± s.d. n = 4 mice per group. d Upper panels: representative images of immunohistochemical (IHC) analysis of 10 breast cancer samples stratified on the basis of p53 protein levels (high and low) (n = 5 for each condition). Samples were stained with anti-p53, anti-PSAT1, anti-LAT1, anti-CD98hc, and anti-Phospho-4EBP1 antibodies. CD98hc is encoded by SLC3A2 and LAT1 by SLC7A5. Original magnification, x200. Scale bar, 100 µm. Lower panels: quantitative analyses of IHC markers analyzed. e Average expression levels of SLC7A5, SLC3A2, SLC1A5, SSP genes (i.e., PHGDH, PSAT1, and PSPH), and a gene set of mTORC1 activation in human breast cancer samples of the Metabric dataset (n = 701) classified according to p53 status (wt and missense TP53 mutations). Two-tailed Student’s t-test. Source data are provided as a Source Data file.

