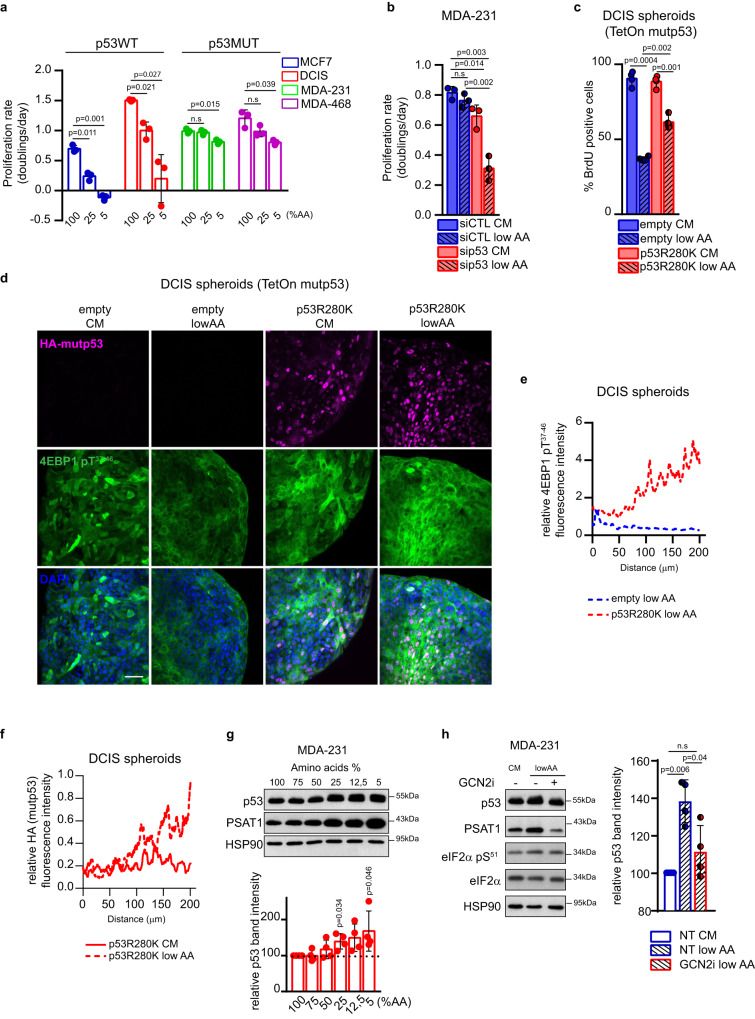
Fig. 3. Mutp53 enables cancer cells to cope with AA restriction.
a Proliferation rate (doubling times/day) of indicated cell lines in medium containing 100%, 25%, and 5% of AAs for 3 days; n = 3 biological replicates. b Proliferation rate (doublings /day) of MDA-MB 231 cells cultured in complete medium (CM) or medium containing 25% of AAs (low AA) upon silencing of p53 for 3 days; n = 3 biological replicates. c BrdU incorporation analysis in indicated MCF10DCIS.COM TetOn inducible spheroids grown in complete medium (CM) or medium containing 25% of AAs (low AA), in presence of doxycycline 1 μg/mL for 72 h. BrdU was added 12 h before harvesting. The percentage of BrdU positive cells in 900 nuclei/spheroid is shown; n = 4 biological replicates. d Immunofluorescence analysis of HA-mutp53 and p4EBP1 in MCF10DCIS.COM spheroids maintained for 72 h in complete medium (CM) or medium containing 25% of AAs (low AA) upon overexpression of mutp53 R280K (in presence of doxycycline 1 μg/mL for 72 h); n = 4 biological replicates. Scale bar 40 μm. e Quantification of the relative fluorescence intensity profile of p4EBP1, normalized according to nuclei staining (DAPI). f. Quantification of the relative fluorescence intensity profile of HA-mutp53, normalized according to nuclei staining (DAPI). g Upper panel: western blot analysis of the indicated proteins in MDA-MB 231 cells grown for 72 h in the indicated percentage of AAs. Lower panel: quantification of p53 levels relative to HSP90 in western blot; n = 4 h Left panel: western blot analysis of the indicated proteins in MDA-MB 231 cells grown for 72 h in complete medium (CM) and in medium containing 25% of AAs (low AA) with (+) or without (-) GCN2i 1 μM for 72 h. Right panel: quantification of p53 levels relative to HSP90 in western blot; n = 4 biological replicates. Graph bars represent mean±s.d. Two-tailed Student’s t-test. Source data are provided as a Source Data file.

