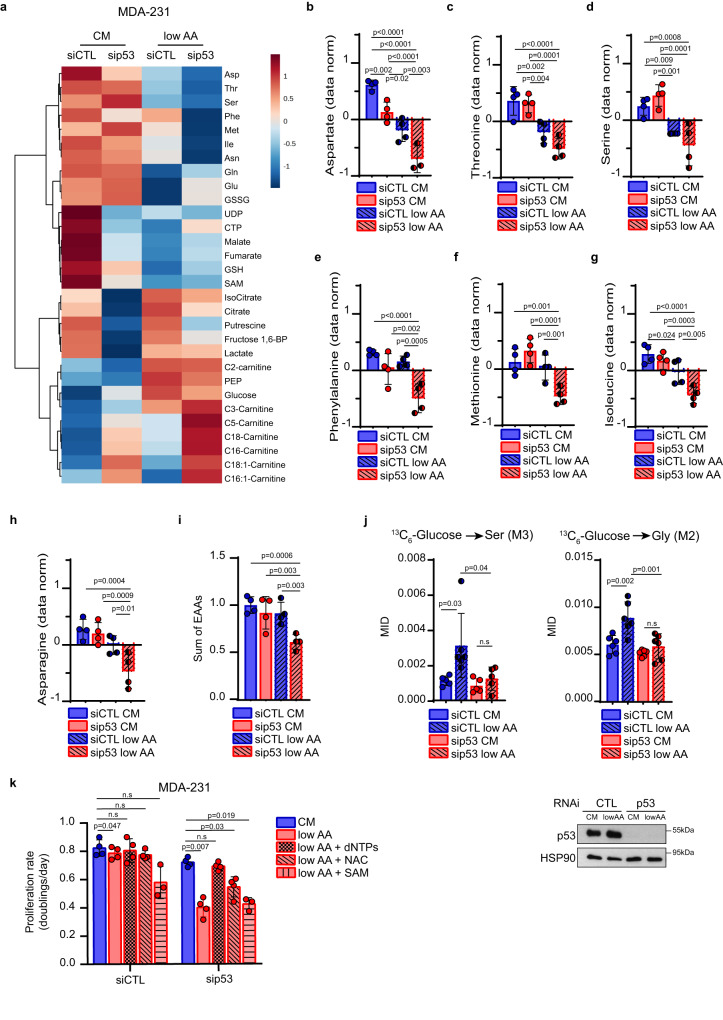
Fig. 4. Mutp53 reprograms AA metabolism in AA restriction to sustain proliferation.
a Heatmap of top 30 significantly regulated metabolites analyzed by steady-state metabolomic analysis in MDA-MB 231 cells cultured for 3 days in complete medium (CM) or medium containing 25% of AAs (low AA) upon control (siCTL) or p53 (sip53) silencing. Each column represents the average of each experimental group; n = 4 independent replicates (one single experiment). b–h Histograms showing the normalized abundance of top 7 regulated AAs emerged from a. n = 4 independent replicates (one single experiment). i Histogram showing the sum of EAAs (normalized values of Val, Thr, Leu, Ile, Met, His, Phe, Trp, Lys) from LC-MS analysis. n = 4 independent replicates (one single experiment). j Upper panels: mass isotopomer distribution (MID) of serine M3 (left) and glycine M2 (right) from [U-13C6]-Glucose in MDA-MB 231 cells under above-described conditions. For labeling experiments, [U-13C6]-Glucose was added in the medium 24 h before harvesting. Lower panel: western blot analysis of p53 levels in the above-described condition. HSP90 was used as loading control; n = 6 biological replicates. k Proliferation rate (doublings/day) of MDA-MB 231 cells cultured in complete medium (CM) or medium containing 25% of AAs (low AA) upon silencing of p53 for 3 days and, where indicated, supplemented with dNTPs 100 μM, N-Acetylcysteine (NAC) 1.25 mM and S-adenosylmethionine (SAM) 200 μM; n = 4 (n = 3 in low AA + SAM) biological replicates. Two-tailed Student’s t-test or Ordinary one-way ANOVA test (Fisher’s LSD). Source data are provided as a Source Data file.

