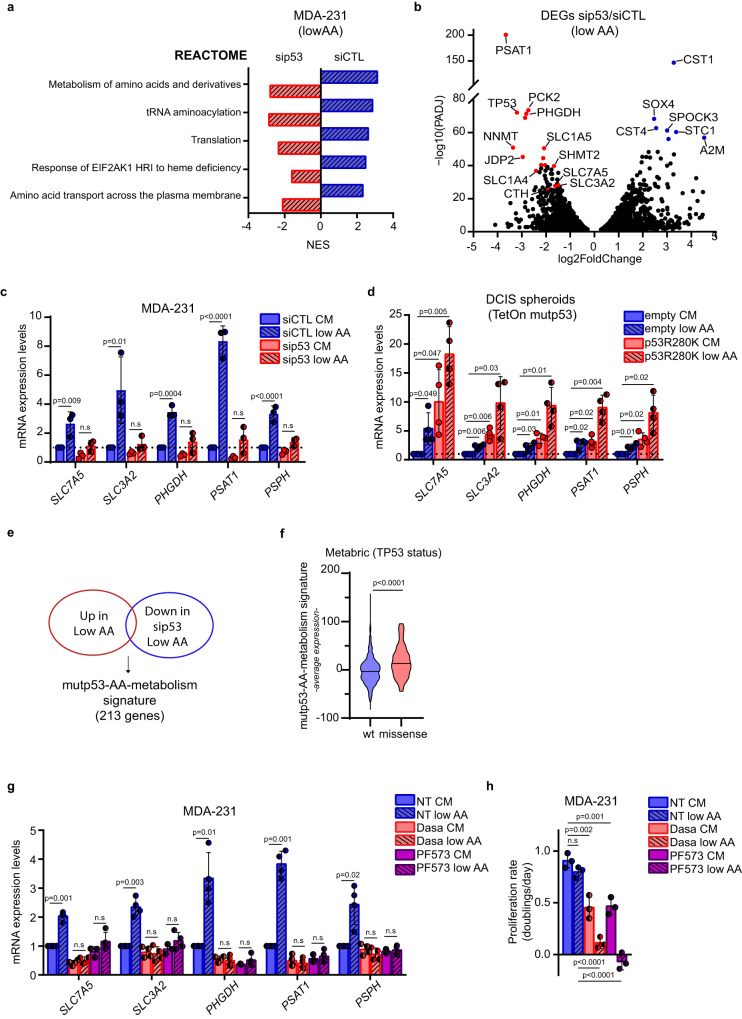
Fig. 5. Mutp53 controls a specific AA metabolic transcriptional program in AA restriction.
a. Blue bars: reactome gene sets significantly enriched (padj value < 0.05) in control-silencing MDA-MB-231 cells (siCTL) cultured in low AA vs complete medium. Red bars: reactome gene sets significantly enriched (padj value < 0.05) in MDA-MB-231 cells cultured in low AA upon p53 silencing (sip53) vs low AA upon control silencing. The positive and negative normalized enrichment score (NES) indicates the degree to which Reactome gene sets are overrepresented in the conditions described above. n = 2 biological replicates (GSE214494). b Volcano plot of genes significantly upregulated (blue dots) and downregulated (red dots) (padj value < 0.05) in MDA-MB-231 cells cultured in low AA upon p53 silencing vs low AA upon control silencing (sip53/siCTL). n = 2 biological replicates. c qRT-PCR of indicated genes in MDA-MB 231 cells cultivated for 72 h in complete medium (CM) or medium containing 25% of AAs (low AA) upon silencing of p53. mRNA levels relative to control condition (dotted line) are shown; n = 3 biological replicates. d qRT-PCR of indicated genes in MCF10DCIS.COM TetOn inducible spheroids grown in complete medium (CM) or medium containing 25% of AAs (low AA), in presence of doxycycline 1 μg/mL for 72 h. mRNA levels relative to control condition (dotted line) are shown; n = 4 biological replicates. e Venn Diagram depicting common genes significantly upregulated (padj value < 0.05) in MDA-MB-231 siCTL cells when cultured in low AA and significantly downregulated upon silencing of p53 in low AA. f Average expression levels of mutp53-AA-metabolism signature in human BC samples of the Metabric dataset (n = 701) classified according to p53 status. g qRT-PCR of the indicated genes in MDA-MB 231 cells cultured in complete medium (CM) or medium containing 25% AAs (low AA) and treated with DMSO (NT), Dasatinib (Dasa) 0,5 μM or PF573228 (PF573) 10 μM for 72 h. mRNA levels relative to untreated condition in complete medium (NT CM) are shown; n = 4 biological replicates. h Proliferation rate (doublings/day) of MDA-MB 231 cells cultured as in g; n = 3 biological replicates. Graph bars represent mean±s.d. Two-tailed Student’s t-test or Ordinary one-way ANOVA test or Wilcoxon Rank Sum test or Wald test (pval) and bonferroni correction (padj). Cutoff padj<0.05. Source data are provided as a Source Data file.

