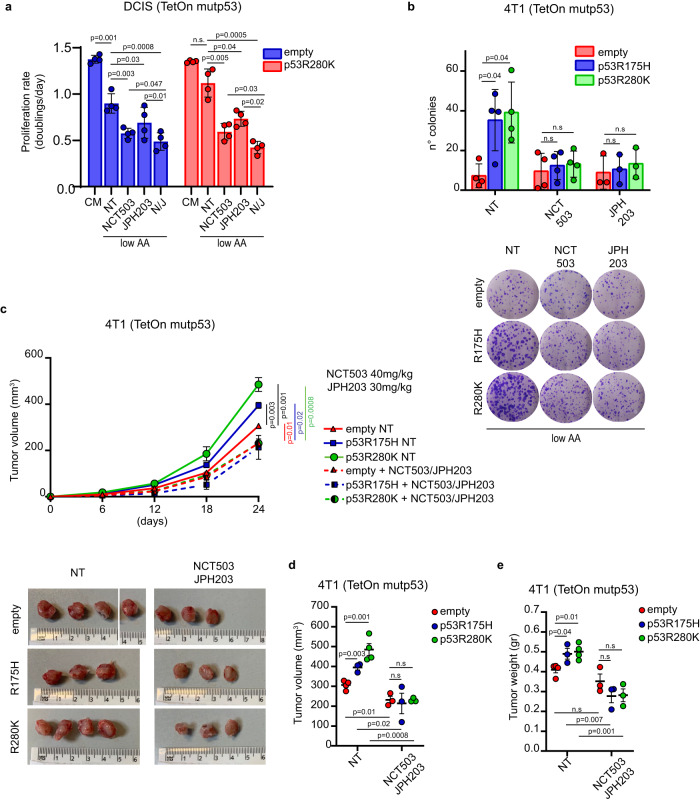
Fig. 6. LAT1 and SSP inhibition dampens mutp53-dependent tumor growth.
a Proliferation rate (doubling times/day) of MCF10DCIS.COM TetOn inducible clones cultured in complete medium (CM) or medium containing 25% of AAs (low AA) in presence of doxycycline 1 μg/mL for 72 h and treated with DMSO (NT), NCT-503 10 μM, JPH203 10 μM or combination of NCT503 10μM-JPH203 10 μM (N/J); n = 4 biological replicates. b Upper panel: quantification of the number of colonies formed by the indicated 4T1 TetOn inducible clones grown in medium containing 25% AAs (low AA) in presence of doxycycline 1 μg/mL, treated with DMSO (NT), NCT-503 1 μM or JPH203 1μ. Lower panel: representative images of colonies described above; n = 4 (n = 3 in JPH203) biological replicates. c Upper panel: tumor growth rate in mice after injection of indicated 4T1 TetOn inducible clones upon treatment with placebo (NT) or combination of NCT503/JPH203. Lower panel: images of tumors on day 24 after injection. n = 3/condition except for n = 4 in empty NT and p53R280K NT. d, e Quantification of difference in tumor volume and weight at day 24 after injection of the above-described tumors. n = 3/condition except for n = 4 in empty NT and p53R280K NT. Graph bars (a, b) represent mean±s.d. In vivo data (c–e) are shown as mean ± SE. In scatter dot plots, each dot represents one mouse. Two-tailed Student’s t-test. Source data are provided as a Source Data file.

