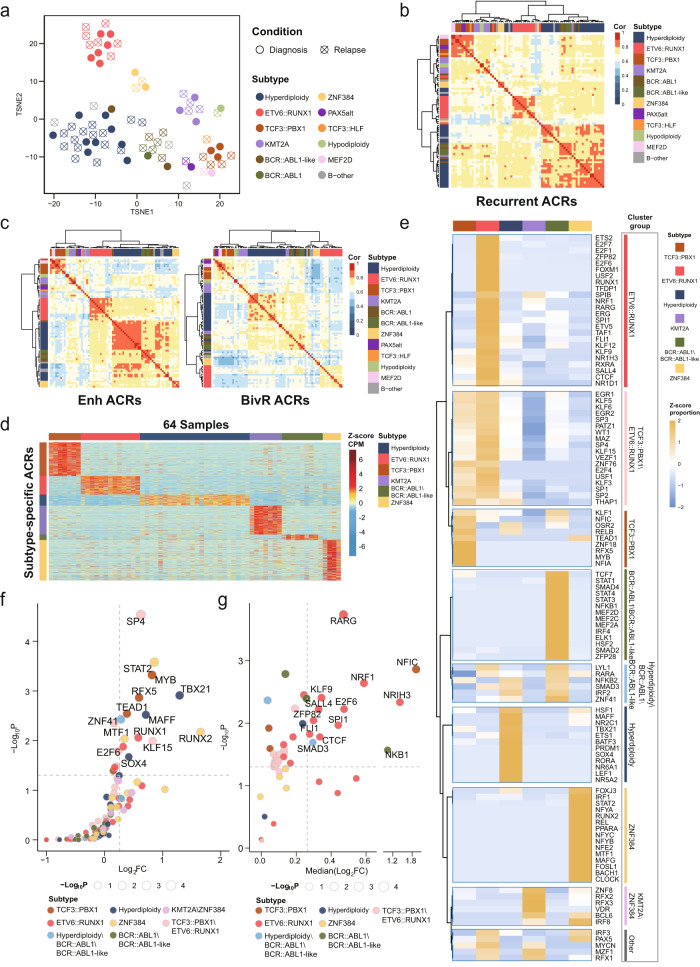
Fig. 2. Subtype-specific chromatin accessibility in B-ALL.
a The t-distributed stochastic neighbor embedding (t-SNE) plot showing the clustering of 75 B-ALL samples based on recurrent c-ACRs with top 10% highest variance. b Heatmap of Pearson correlation coefficients shows the inter-sample correlation of chromatin accessibility based on all recurrent ACRs. c Heatmaps of Pearson correlation coefficients based on ACRs in Enh regions (left) and ACRs in BivR regions (right) showing the inter-sample similarity of chromatin accessibility. d The accessibility of 17,981 subtype-specific ACRs in 64 B-ALL samples is shown in heatmap. The x axis presents 64 B-ALL samples and y axis displays subtype-specific ACRs. e Unsupervised clustering of 109 transcription factors (TF) based on their enrichment in each subtype, as labeled on the right of this plot. f Differential expression analysis of subtype enriched TFs in B-ALL. The TFs are colored according to the clusters in (e). For each TF, statistical analysis was performed to test the expression difference between B-ALLs of the enriched subgroup versus the others. Each dot represents an individual TF. Horizontal dashed line represents p = 0.05 and vertical dashed line represents fold change (FC) = 1.2. Gene symbols of TFs with p < 0.05 (one-sided Wilcoxon test) and FC > 1.2 are showed. g Expression analysis of target genes of subtype enriched TFs. Only TFs with binding motif in gene promoter region (TSS ± 1 kb) were included. Differential expression analysis was performed for each target gene between B-ALLs grouped upon the enriched subgroups of TF. The median fold change (FC) of all target genes regulated by the individual TF is showed on x axes. Each dot represents a group of target genes for an individual TF. Horizontal dashed line represents p = 0.05 and vertical dashed line represents fold change (FC) = 1.2. Gene symbols of TF with target genes satisfied geometric mean p < 0.05 (one-sided Wilcoxon test for each target gene) and FC > 1.2 are labeled.

