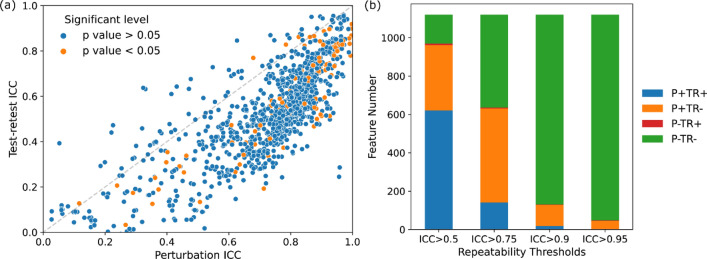
Figure 2.
(a) Scatter plots showing the repeatability of volume independent features measured by intra-class correlation coefficient (ICC) under test–retest imaging (y-axis) and image perturbation (x-axis). The perturbation method yielded higher ICC values than the test–retest method in general. Furthermore, features that had significant univariate correlations with the outcome, pCR, where colored as orange while the rest as blue. (b) Stacked bar plot displaying the feature repeatability agreement between perturbation and test–retest. P + / − indicates the repeatable/unrepeatable feature group by the perturbation method and TR + / − for repeatable/unrepeatable feature group in the test–retest method.

