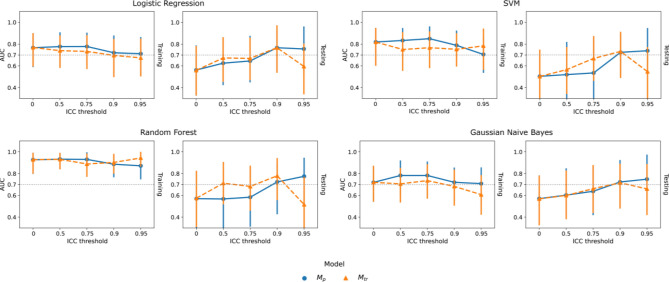
Figure 3.
Comparison of internal generalizability between models based on repeatable features assessed by image perturbation (, blue) and the test–retest imaging (, orange) under varying thresholds for logistic regression, SVM, random forest, and gaussian naive bayes classifiers. Training and testing classification performance were quantified by area under the receiver operating characteristic curve (AUC). The error bars indicate 95% confidence intervals acquired from 1000-iteration bootstrapping.

