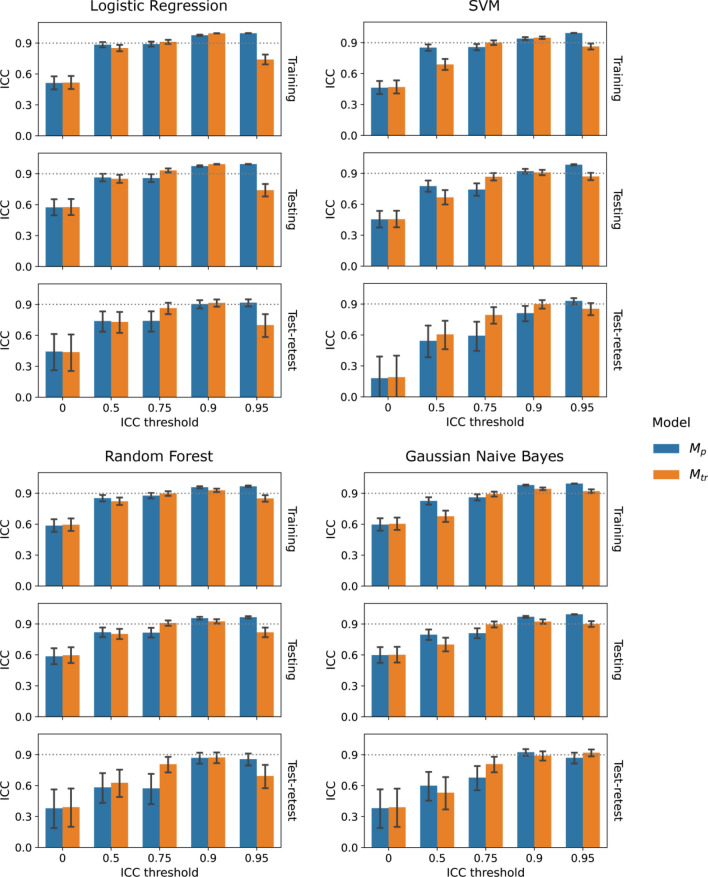
Figure 4.
Bar plots for comparing robustness between models based on repeatable features assessed by image perturbation (, blue) and the test–retest imaging (, orange) under varying thresholds for logistic regression, SVM, random forest, and gaussian naive bayes classifiers. Model robustness was evaluated by probability prediction ICC under perturbation or tests-retest. The error bars indicate 95% confidence intervals acquired during ICC calculation.

