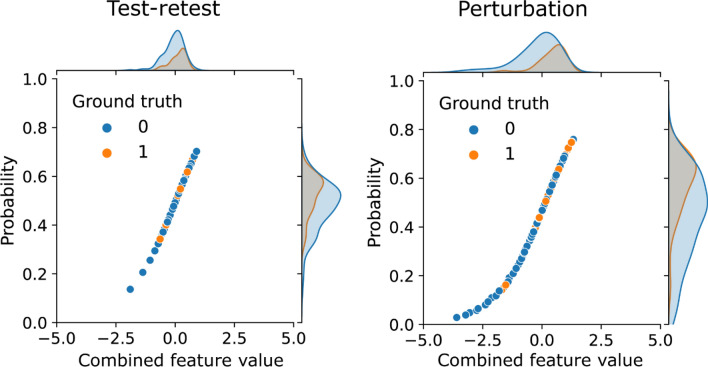
Figure 5.
Distributions of the linearly combined feature values and predicted probabilities of the logistic regression models developed from test–retest repeatable features and perturbation repeatable features using the feature intra-class correlation coefficient threshold of 0.95. The predicted probabilities follow the sigmoid mapping of the logistic regression. Samples with ground-truth of non-event are colored by blue and event by orange. Predictions of the test–retest model were aggregated in the high-slop region whereas a wider spread is found for the perturbation model.

