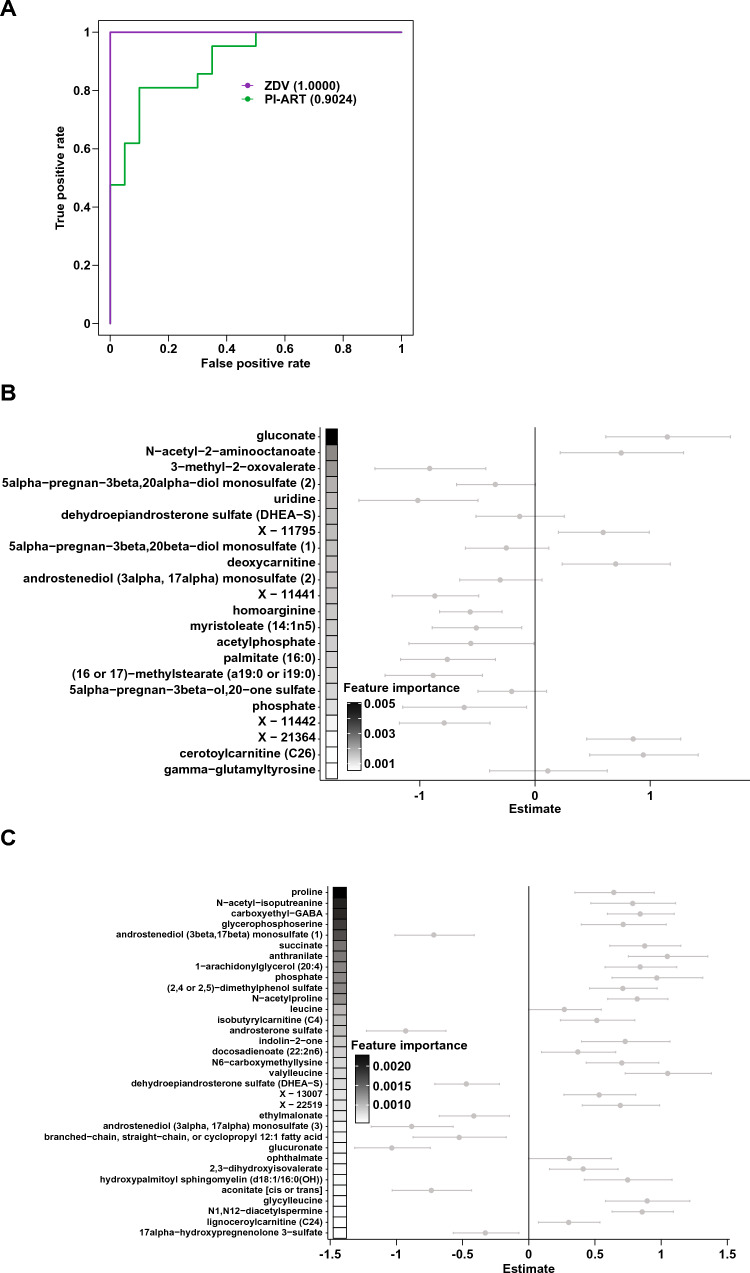
Fig. 5.
Infant signatures of preterm birth. Random forests (RF) model for preterm birth using infant DBS-derived metabolite profiles. a Receiver-operator characteristic curves for classification models of birth status for each treatment regimen as indicated. Numbers in parentheses indicate the area under the ROC curve (AUC). b–c RF models for preterm birth in infants exposed to (b) zidovudine monotherapy and c PI-ART in utero. Features are ordered by decreasing importance in the RF model as shown by shaded boxes on the left. Points and error bars show the coefficients and 95% confidence intervals from linear regression analysis of the same metabolite. Metabolites with positive estimates are increased in preterm infants and metabolites with negative estimates are increased in term infants

