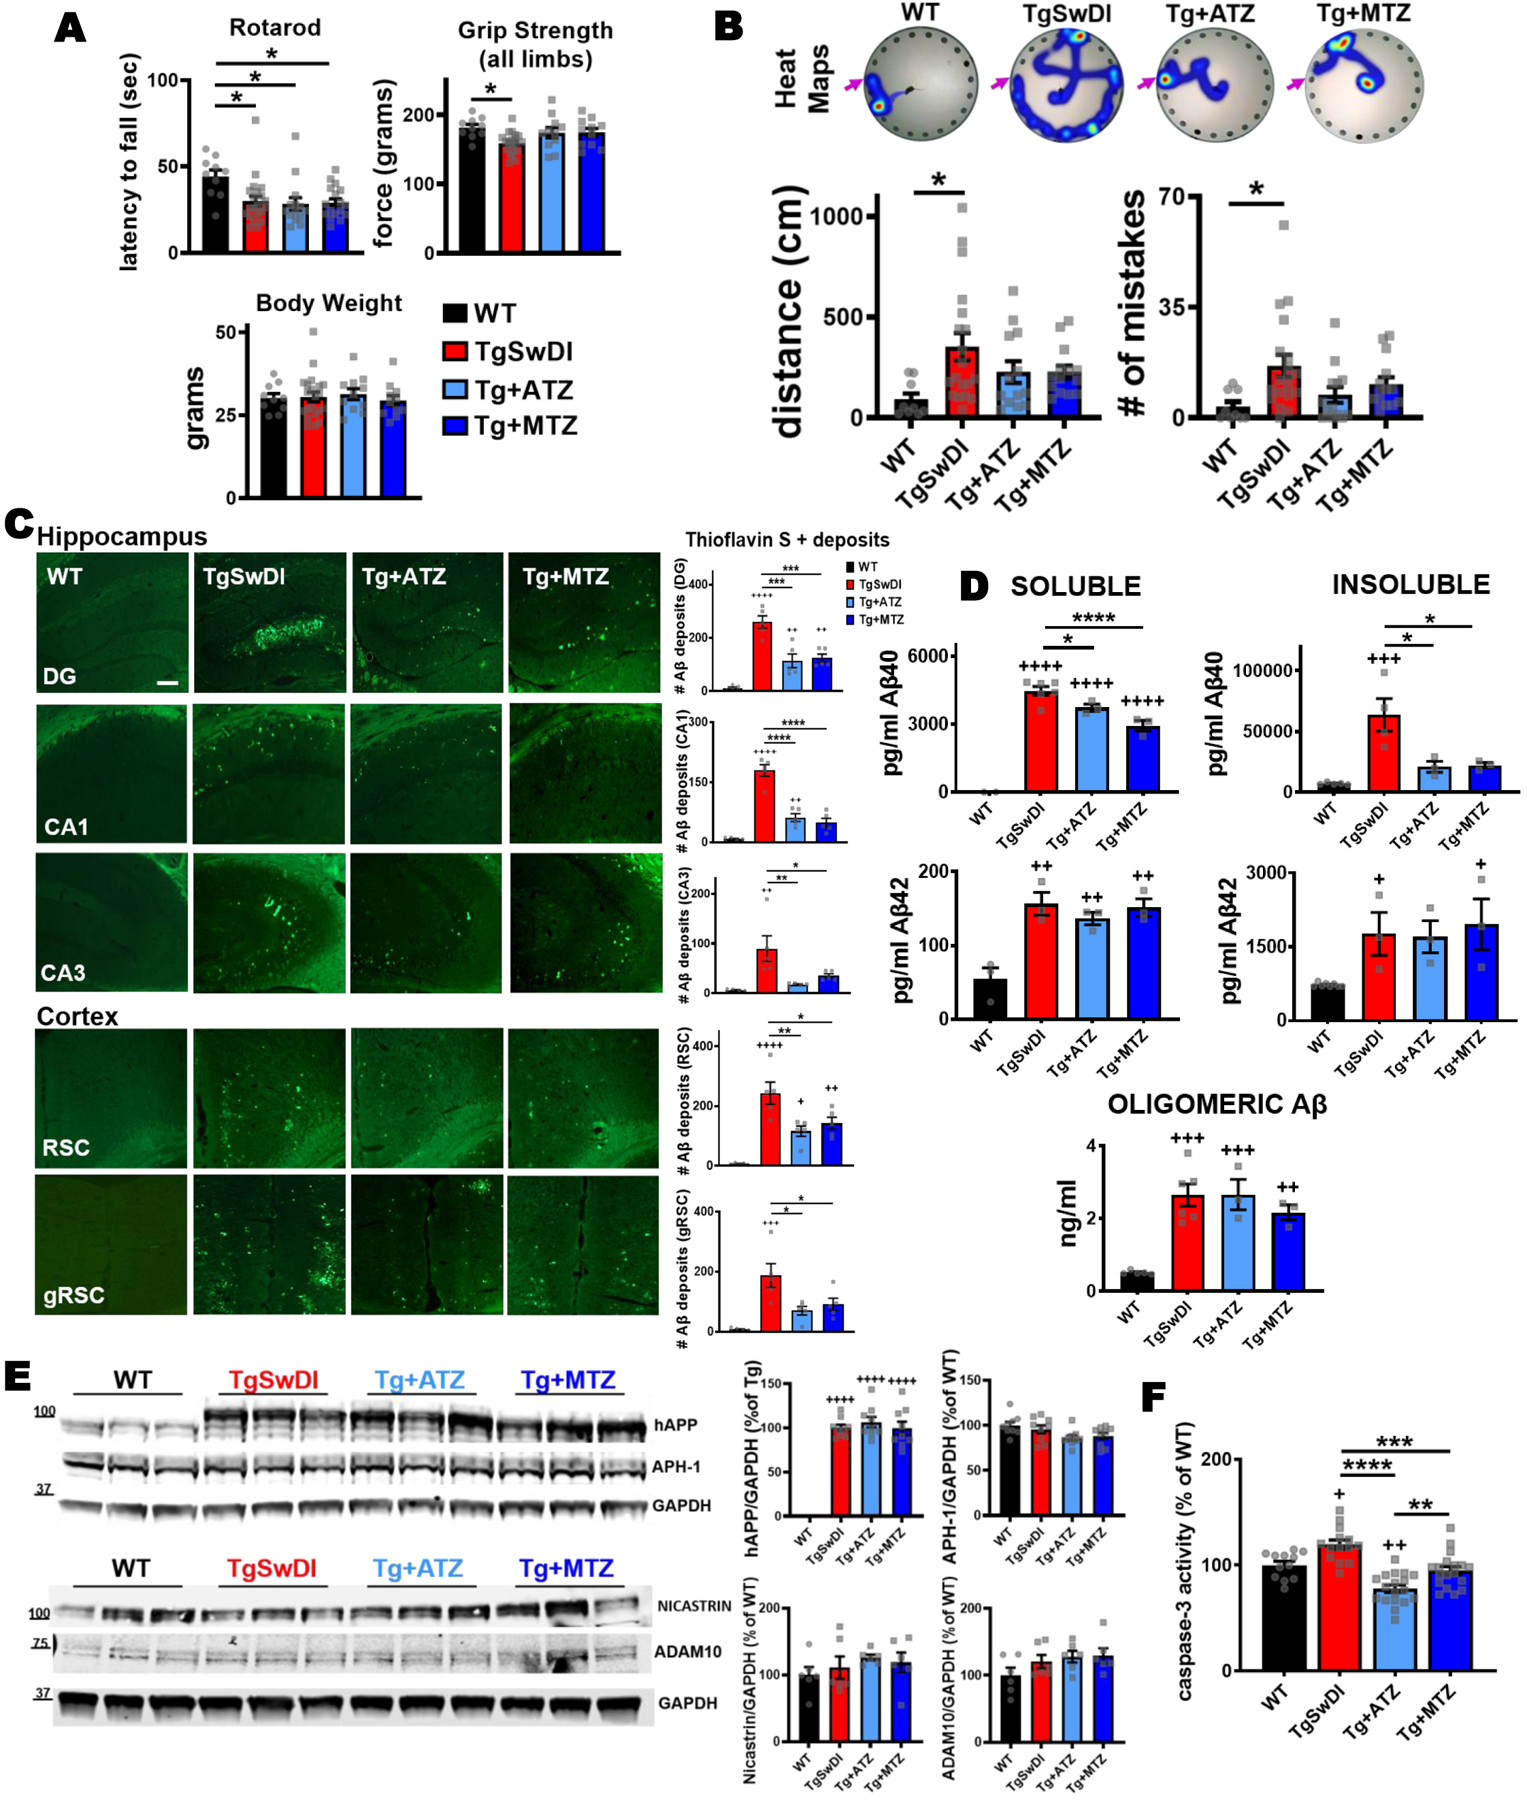
Figure 1: CAI treatment attenuates cognitive impairment, reduces brain Aβ pathology and decreases caspase-3 activation in TgSwDI mice.

A) CAIs did not affect motor coordination tested with rotarod. In the rotarod performance, there was a significant main effect of group (F(1,57)=4.863, p=0.004) with body weight significant as covariate (F(1,57)=6.059, p=0.017). Post-hoc tests showed that all Tg groups were significantly impaired relative to WT control mice (TgSwDI p=0.016, Tg+ATZ p=0.012, Tg+MTZ p=0.006). The analysis of motor function tested with grip strength (all limbs) showed that there was a significant main effect of group (F(3,57)=5.449, p=0.002) on grip strength with body weight significant as covariate (F(1,57)=29.302, p=0.000). Post-hoc comparisons revealed that untreated TgSwDI mice had lower all-limb grip strength than WT mice (p=0.003). Body weight did not change between groups. B) Spatial memory tested via Barnes maze task in 15/16-month-old WT and TgSwDI mice, in the presence or absence of MTZ- or ATZ-treatment. The heat maps show the path (in blue) covered by the animals to reach the escape hole (indicated with pink arrows) in the probe test. The plots represent the distance covered (cm) and the number of mistakes made before finding the escape hole, during the probe test. There was a significant main effect of group on appropriately transformed indices of distance (F(3, 48)=4.456, p=0.008) and mistakes (F(3, 48)=5.059, p=0.004). Post-hoc comparisons between groups on each measure revealed that only untreated Tg mice were impaired in distance (p=0.0104) and mistakes (p=0.0117), compared to WT animals. Same pattern of results was observed with ANOVA applied to the untransformed data or when using nonparametric Kruskal Wallis analysis. WT: N=10, TgSwDI: N=19, ATZ: N=13 and MTZ: N=14. Two-way ANOVA and Dunn’s post-hoc test. Data are expressed as mean ± SEM. C) Representative images of cerebral Aβ deposits stained with Thioflavin S. 16-month-old untreated TgSwDI mice exhibit a greater amount of Aβ, in both hippocampus (DG, CA1 and CA3 areas) and cortex (retrosplenial and granular retrosplenial cortex, RSC and gRSC), compared to WT animals. CAI treatment significantly decreases Aβ deposits in all areas. Original magnification, 20x. Scale bar 150μm. On the right, relative quantification. WT, TgSwDI, ATZ and MTZ: N=5, n≥10 measurements acquired/group. D) Brain Aβ content measured by ELISA in soluble and insoluble fractions. Compared to age-matched WT, 16-month-old TgSwDI animals show significantly higher concentration (pg/ml) of both soluble and insoluble Aβ40 and Aβ42. CAI treatment diminishes soluble Aβ40, and even more considerably insoluble Aβ40, compared to Tg mice. Oligomeric Aβ content (ng/ml) within the soluble fraction does not significantly change among Tg groups. Graphs represent N=3–8 animals/group, n=2 measurement/animal. E) CAI treatment does not change the expression of hAPP and APP metabolism enzymes APH-1 and nicastrin (γ-secretase subunits), and ADAM10 (α-secretase). Quantification (right side), normalized vs GAPDH, and expressed in percentage vs WT mice (or % vs Tg in hAPP graph). N=3 mice/group, n=9 technical replicates/group. F) Caspase-3 activity measured in brain homogenates. ATZ and MTZ treatments significantly reduce total cerebral caspase-3 activation, compared to untreated TgSwDI mice. N=3–5 mice/group, n ≥12 measurements/group. In (C-F), one-way Anova and Tukey’s post-hoc test: * (vs Tg) and + (vs WT) p<0.05, ** and ++ p<0.01, *** and +++ p<0.001, **** and ++++ p<0.0001. Data are expressed as mean ± SEM.
