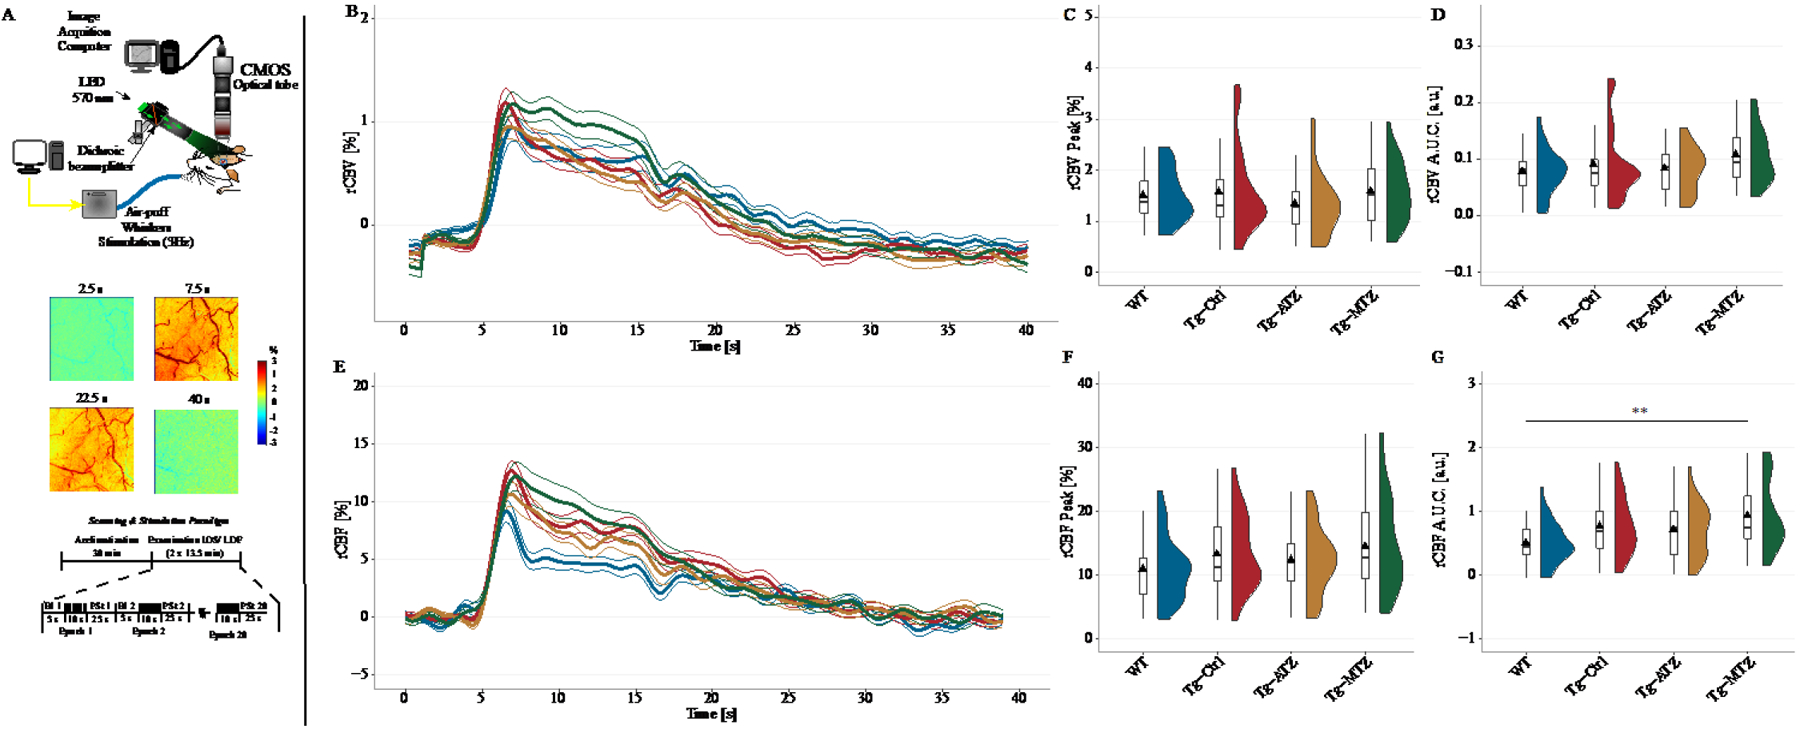
Figure 3: Analysis of cerebral blood flow and volume during functional activation.

A) Experimental setup for IOS to measure total Hemoglobin (Hb), a proxy for cerebral blood volume (CBV). A LED constantly illuminated the cranial window with a spectrum of 570 ± 2nm (top), while AVI videos were recorded using a CMOS camera at 5-fps. IOS relies on the reflectance of light from the illuminated cortex. At 570nm, both oxy- and deoxy-Hb are absorbed at the same rate, equivalent to total Hb (rCBV). Whisker stimulation increases CBV, reducing the reflectance, hence the signal. In the postprocessing, the signal was inverted for better representation (middle). For IOS and LDF, whisker stimulation occurred from the second 5 to the second 15 in each epoch (bottom). B) Relative changes in CBV to the baseline (rCBV [%]) were estimated and plotted as time-series. C) No difference between the groups in the maximum CBV response (rCBV Peak [%]) to stimulation, and area under the curve (rCBV A.U.C. [a.u.]) (D), during the stimulation period (10’). E) Estimated changes in regional cerebral blood flow (CBF) during functional activation, using a commercial LDF. F) No difference between groups in the maximum response to functional activation (rCBF Peak [%]). G) Analysis of the A.U.C. for regional CBF (rCBF A.U.C. [a.u.]). Tg+MTZ mice showed an overall increase in CBF response during the stimulation period, compared to the WT mice. N values: WT = 16 mice (8 males and 8 females); TgSwDI, N=17 (6 males and 11 females); Tg+ATZ, N=17 (11 males and 6 females); Tg+MTZ, N=16 (8 males and 8 females). ** p<0.01. Abbreviations: Bl: Baseline, PSt: poststimulation. Statistics: Cluster analysis using linear mixed-models predicting the changes in peak and A.U.C. by stimulation and adjusted for gender.
